Immigrants from Afghanistan vs Immigrants from South America In Labor Force | Age 30-34
COMPARE
Immigrants from Afghanistan
Immigrants from South America
In Labor Force | Age 30-34
In Labor Force | Age 30-34 Comparison
Immigrants from Afghanistan
Immigrants from South America
84.5%
IN LABOR FORCE | AGE 30-34
23.5/ 100
METRIC RATING
194th/ 347
METRIC RANK
84.7%
IN LABOR FORCE | AGE 30-34
50.0/ 100
METRIC RATING
175th/ 347
METRIC RANK
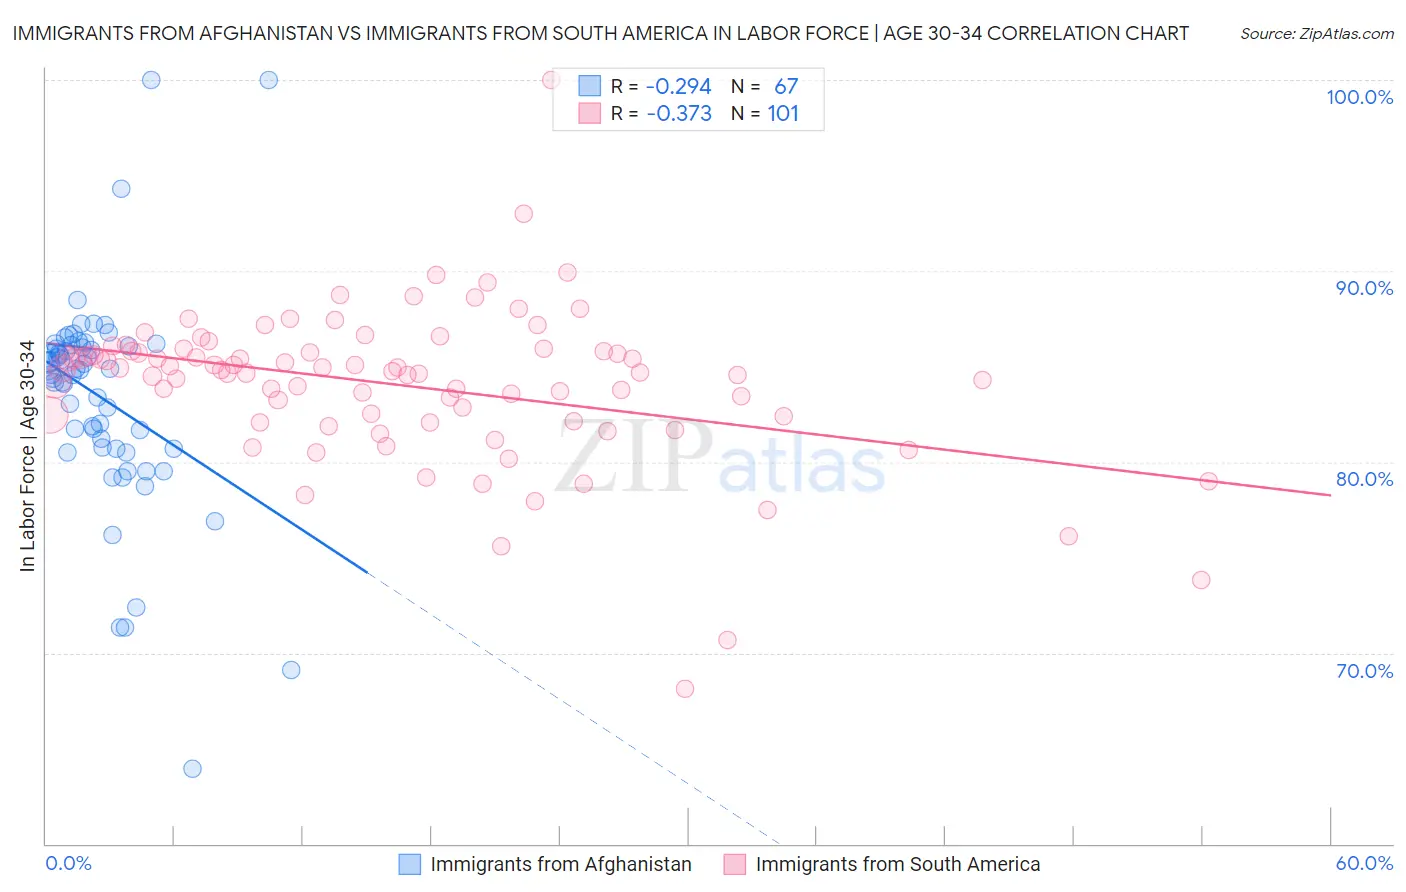
Immigrants from Afghanistan vs Immigrants from South America In Labor Force | Age 30-34 Correlation Chart
The statistical analysis conducted on geographies consisting of 147,638,034 people shows a weak negative correlation between the proportion of Immigrants from Afghanistan and labor force participation rate among population between the ages 30 and 34 in the United States with a correlation coefficient (R) of -0.294 and weighted average of 84.5%. Similarly, the statistical analysis conducted on geographies consisting of 485,985,237 people shows a mild negative correlation between the proportion of Immigrants from South America and labor force participation rate among population between the ages 30 and 34 in the United States with a correlation coefficient (R) of -0.373 and weighted average of 84.7%, a difference of 0.21%.
In Labor Force | Age 30-34 Correlation Summary
| Measurement | Immigrants from Afghanistan | Immigrants from South America |
| Minimum | 63.9% | 68.1% |
| Maximum | 100.0% | 100.0% |
| Range | 36.1% | 31.9% |
| Mean | 83.4% | 84.0% |
| Median | 84.8% | 84.7% |
| Interquartile 25% (IQ1) | 80.7% | 82.3% |
| Interquartile 75% (IQ3) | 86.0% | 85.8% |
| Interquartile Range (IQR) | 5.3% | 3.5% |
| Standard Deviation (Sample) | 5.7% | 4.1% |
| Standard Deviation (Population) | 5.7% | 4.1% |
Demographics Similar to Immigrants from Afghanistan and Immigrants from South America by In Labor Force | Age 30-34
In terms of in labor force | age 30-34, the demographic groups most similar to Immigrants from Afghanistan are Immigrants from Costa Rica (84.5%, a difference of 0.0%), Hungarian (84.5%, a difference of 0.010%), Scandinavian (84.5%, a difference of 0.010%), Immigrants from Zaire (84.5%, a difference of 0.020%), and Taiwanese (84.6%, a difference of 0.050%). Similarly, the demographic groups most similar to Immigrants from South America are Finnish (84.7%, a difference of 0.0%), Immigrants from Uzbekistan (84.7%, a difference of 0.010%), Laotian (84.7%, a difference of 0.020%), Okinawan (84.6%, a difference of 0.040%), and Immigrants from Nigeria (84.6%, a difference of 0.050%).
| Demographics | Rating | Rank | In Labor Force | Age 30-34 |
| Finns | 50.0 /100 | #174 | Average 84.7% |
| Immigrants | South America | 50.0 /100 | #175 | Average 84.7% |
| Immigrants | Uzbekistan | 49.1 /100 | #176 | Average 84.7% |
| Laotians | 46.9 /100 | #177 | Average 84.7% |
| Okinawans | 44.1 /100 | #178 | Average 84.6% |
| Immigrants | Nigeria | 42.5 /100 | #179 | Average 84.6% |
| Immigrants | Netherlands | 42.1 /100 | #180 | Average 84.6% |
| Moroccans | 40.3 /100 | #181 | Average 84.6% |
| Barbadians | 36.7 /100 | #182 | Fair 84.6% |
| Immigrants | Canada | 35.0 /100 | #183 | Fair 84.6% |
| Immigrants | North America | 33.3 /100 | #184 | Fair 84.6% |
| Immigrants | Philippines | 31.5 /100 | #185 | Fair 84.6% |
| Immigrants | Congo | 29.7 /100 | #186 | Fair 84.6% |
| Costa Ricans | 29.6 /100 | #187 | Fair 84.6% |
| Taiwanese | 29.4 /100 | #188 | Fair 84.6% |
| Nigerians | 28.9 /100 | #189 | Fair 84.5% |
| Immigrants | Zaire | 25.8 /100 | #190 | Fair 84.5% |
| Hungarians | 24.8 /100 | #191 | Fair 84.5% |
| Scandinavians | 24.7 /100 | #192 | Fair 84.5% |
| Immigrants | Costa Rica | 23.9 /100 | #193 | Fair 84.5% |
| Immigrants | Afghanistan | 23.5 /100 | #194 | Fair 84.5% |