Creek vs Puget Sound Salish In Labor Force | Age 30-34
COMPARE
Creek
Puget Sound Salish
In Labor Force | Age 30-34
In Labor Force | Age 30-34 Comparison
Creek
Puget Sound Salish
80.4%
IN LABOR FORCE | AGE 30-34
0.0/ 100
METRIC RATING
329th/ 347
METRIC RANK
82.1%
IN LABOR FORCE | AGE 30-34
0.0/ 100
METRIC RATING
308th/ 347
METRIC RANK
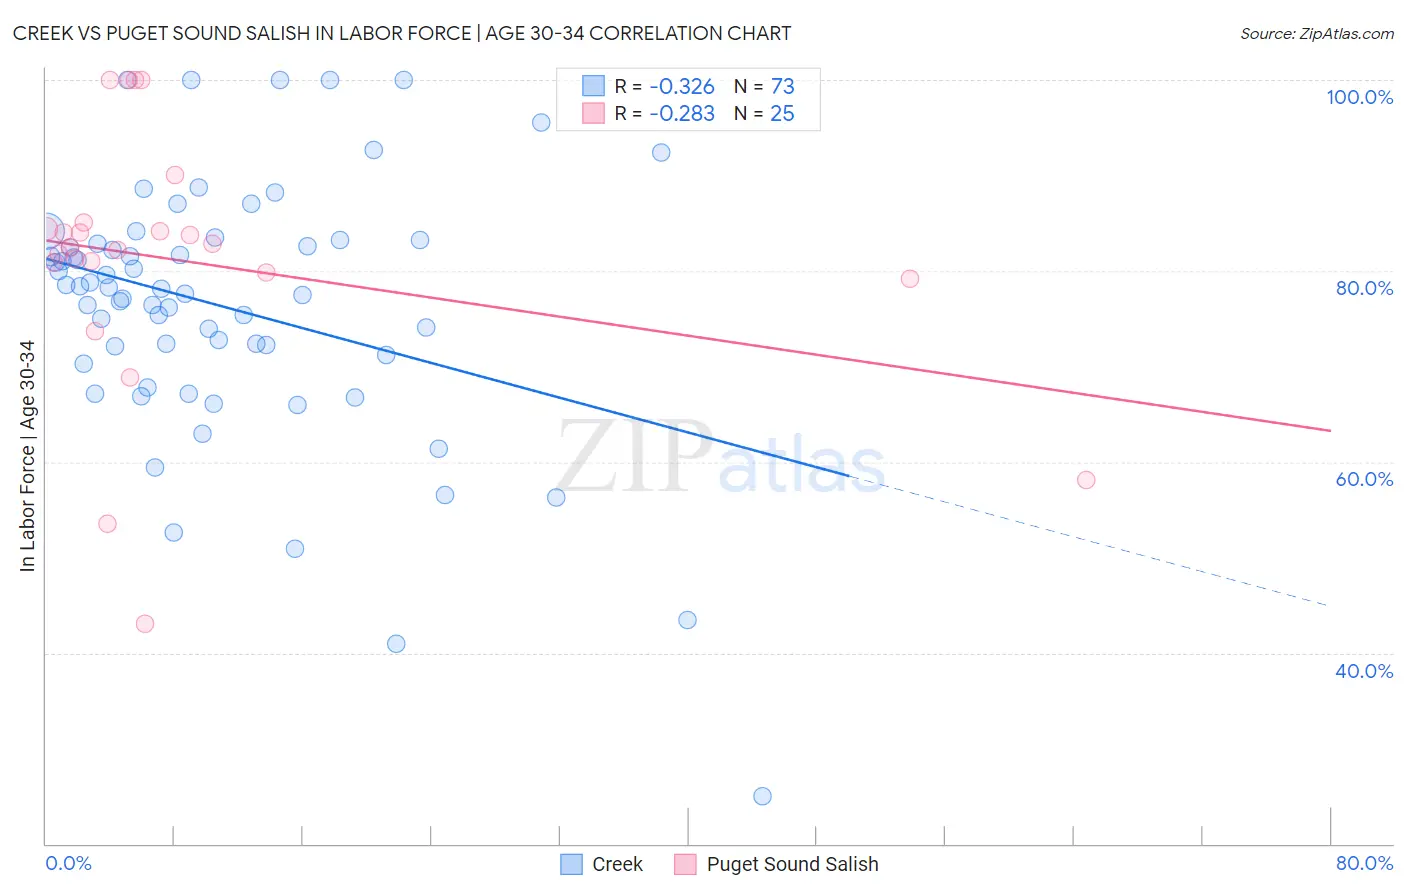
Creek vs Puget Sound Salish In Labor Force | Age 30-34 Correlation Chart
The statistical analysis conducted on geographies consisting of 178,425,767 people shows a mild negative correlation between the proportion of Creek and labor force participation rate among population between the ages 30 and 34 in the United States with a correlation coefficient (R) of -0.326 and weighted average of 80.4%. Similarly, the statistical analysis conducted on geographies consisting of 46,152,160 people shows a weak negative correlation between the proportion of Puget Sound Salish and labor force participation rate among population between the ages 30 and 34 in the United States with a correlation coefficient (R) of -0.283 and weighted average of 82.1%, a difference of 2.2%.
In Labor Force | Age 30-34 Correlation Summary
| Measurement | Creek | Puget Sound Salish |
| Minimum | 25.0% | 43.0% |
| Maximum | 100.0% | 100.0% |
| Range | 75.0% | 57.0% |
| Mean | 76.2% | 81.0% |
| Median | 78.2% | 82.4% |
| Interquartile 25% (IQ1) | 70.7% | 79.5% |
| Interquartile 75% (IQ3) | 83.1% | 84.7% |
| Interquartile Range (IQR) | 12.4% | 5.2% |
| Standard Deviation (Sample) | 13.7% | 13.7% |
| Standard Deviation (Population) | 13.6% | 13.5% |
Similar Demographics by In Labor Force | Age 30-34
Demographics Similar to Creek by In Labor Force | Age 30-34
In terms of in labor force | age 30-34, the demographic groups most similar to Creek are Sioux (80.4%, a difference of 0.010%), Pueblo (80.0%, a difference of 0.40%), Colville (80.7%, a difference of 0.41%), Houma (79.9%, a difference of 0.58%), and Seminole (80.8%, a difference of 0.60%).
| Demographics | Rating | Rank | In Labor Force | Age 30-34 |
| Puerto Ricans | 0.0 /100 | #322 | Tragic 81.2% |
| Paiute | 0.0 /100 | #323 | Tragic 81.2% |
| Cheyenne | 0.0 /100 | #324 | Tragic 81.1% |
| Dutch West Indians | 0.0 /100 | #325 | Tragic 81.0% |
| Seminole | 0.0 /100 | #326 | Tragic 80.8% |
| Colville | 0.0 /100 | #327 | Tragic 80.7% |
| Sioux | 0.0 /100 | #328 | Tragic 80.4% |
| Creek | 0.0 /100 | #329 | Tragic 80.4% |
| Pueblo | 0.0 /100 | #330 | Tragic 80.0% |
| Houma | 0.0 /100 | #331 | Tragic 79.9% |
| Kiowa | 0.0 /100 | #332 | Tragic 79.8% |
| Inupiat | 0.0 /100 | #333 | Tragic 79.7% |
| Hopi | 0.0 /100 | #334 | Tragic 79.3% |
| Marshallese | 0.0 /100 | #335 | Tragic 79.2% |
| Natives/Alaskans | 0.0 /100 | #336 | Tragic 79.2% |
Demographics Similar to Puget Sound Salish by In Labor Force | Age 30-34
In terms of in labor force | age 30-34, the demographic groups most similar to Puget Sound Salish are Menominee (82.2%, a difference of 0.10%), Spanish American Indian (82.2%, a difference of 0.16%), Immigrants from Mexico (82.0%, a difference of 0.16%), Osage (82.3%, a difference of 0.17%), and Cajun (82.0%, a difference of 0.19%).
| Demographics | Rating | Rank | In Labor Force | Age 30-34 |
| Hispanics or Latinos | 0.0 /100 | #301 | Tragic 82.4% |
| Ottawa | 0.0 /100 | #302 | Tragic 82.4% |
| Immigrants | Micronesia | 0.0 /100 | #303 | Tragic 82.4% |
| Tlingit-Haida | 0.0 /100 | #304 | Tragic 82.3% |
| Osage | 0.0 /100 | #305 | Tragic 82.3% |
| Spanish American Indians | 0.0 /100 | #306 | Tragic 82.2% |
| Menominee | 0.0 /100 | #307 | Tragic 82.2% |
| Puget Sound Salish | 0.0 /100 | #308 | Tragic 82.1% |
| Immigrants | Mexico | 0.0 /100 | #309 | Tragic 82.0% |
| Cajuns | 0.0 /100 | #310 | Tragic 82.0% |
| Chickasaw | 0.0 /100 | #311 | Tragic 81.9% |
| Mexicans | 0.0 /100 | #312 | Tragic 81.9% |
| Iroquois | 0.0 /100 | #313 | Tragic 81.9% |
| Alaskan Athabascans | 0.0 /100 | #314 | Tragic 81.7% |
| Cherokee | 0.0 /100 | #315 | Tragic 81.6% |