Immigrants from Afghanistan vs Puget Sound Salish Unemployment Among Ages 30 to 34 years
COMPARE
Immigrants from Afghanistan
Puget Sound Salish
Unemployment Among Ages 30 to 34 years
Unemployment Among Ages 30 to 34 years Comparison
Immigrants from Afghanistan
Puget Sound Salish
5.6%
UNEMPLOYMENT AMONG AGES 30 TO 34 YEARS
27.2/ 100
METRIC RATING
198th/ 347
METRIC RANK
5.1%
UNEMPLOYMENT AMONG AGES 30 TO 34 YEARS
98.2/ 100
METRIC RATING
50th/ 347
METRIC RANK
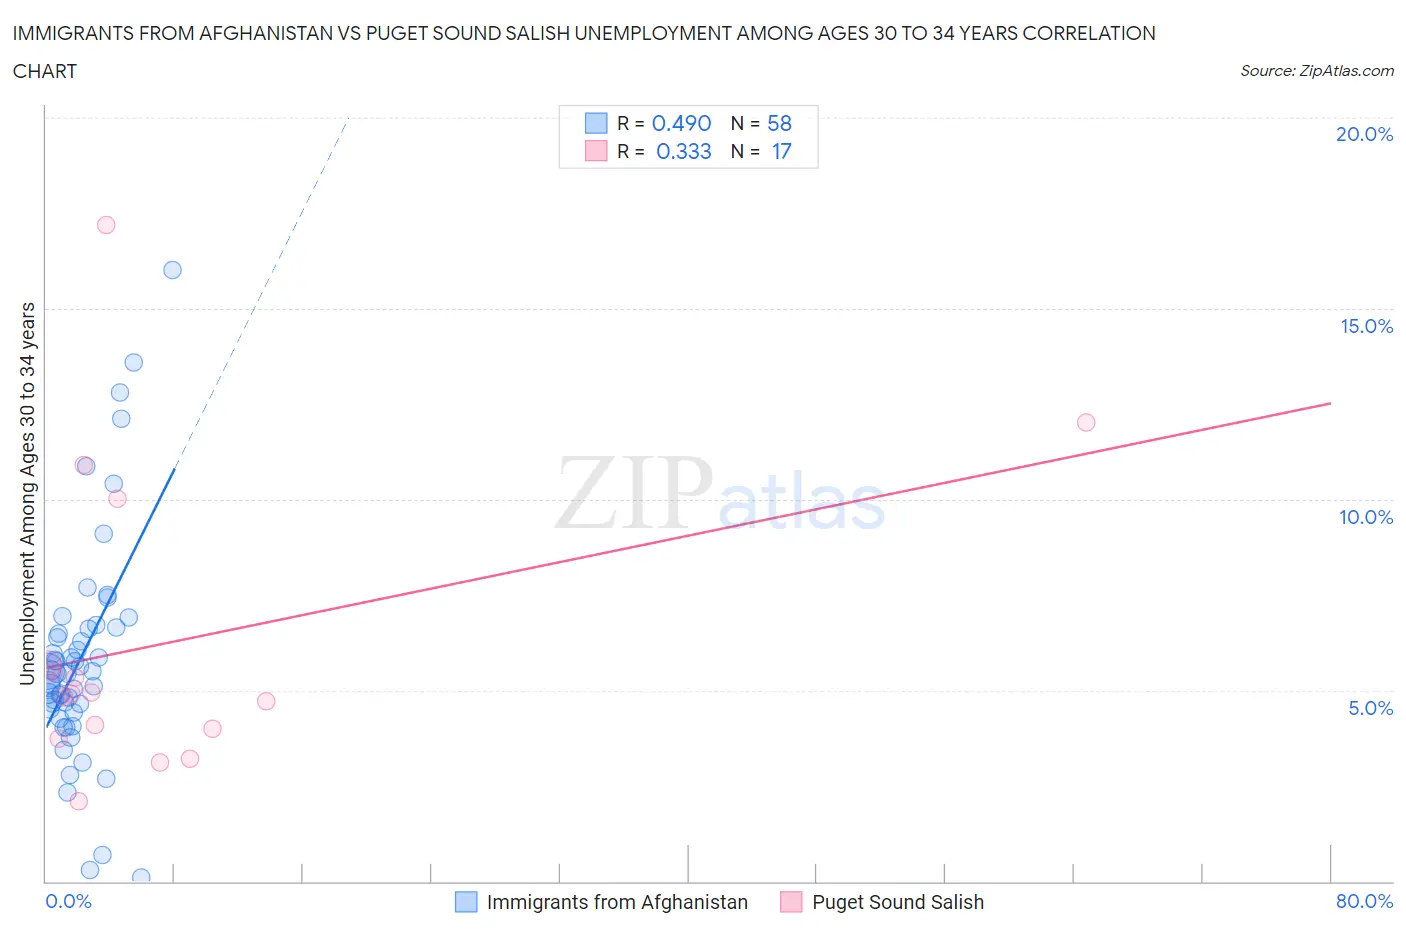
Immigrants from Afghanistan vs Puget Sound Salish Unemployment Among Ages 30 to 34 years Correlation Chart
The statistical analysis conducted on geographies consisting of 145,285,399 people shows a moderate positive correlation between the proportion of Immigrants from Afghanistan and unemployment rate among population between the ages 30 and 34 in the United States with a correlation coefficient (R) of 0.490 and weighted average of 5.6%. Similarly, the statistical analysis conducted on geographies consisting of 45,325,090 people shows a mild positive correlation between the proportion of Puget Sound Salish and unemployment rate among population between the ages 30 and 34 in the United States with a correlation coefficient (R) of 0.333 and weighted average of 5.1%, a difference of 9.3%.
Unemployment Among Ages 30 to 34 years Correlation Summary
| Measurement | Immigrants from Afghanistan | Puget Sound Salish |
| Minimum | 0.10% | 2.1% |
| Maximum | 16.0% | 17.2% |
| Range | 15.9% | 15.1% |
| Mean | 5.8% | 6.2% |
| Median | 5.5% | 4.9% |
| Interquartile 25% (IQ1) | 4.5% | 3.9% |
| Interquartile 75% (IQ3) | 6.6% | 7.9% |
| Interquartile Range (IQR) | 2.1% | 4.0% |
| Standard Deviation (Sample) | 2.9% | 4.0% |
| Standard Deviation (Population) | 2.9% | 3.8% |
Similar Demographics by Unemployment Among Ages 30 to 34 years
Demographics Similar to Immigrants from Afghanistan by Unemployment Among Ages 30 to 34 years
In terms of unemployment among ages 30 to 34 years, the demographic groups most similar to Immigrants from Afghanistan are Nicaraguan (5.6%, a difference of 0.050%), Immigrants from Southern Europe (5.6%, a difference of 0.13%), Immigrants from Nicaragua (5.5%, a difference of 0.14%), Immigrants from South America (5.5%, a difference of 0.22%), and South American Indian (5.6%, a difference of 0.25%).
| Demographics | Rating | Rank | Unemployment Among Ages 30 to 34 years |
| Irish | 31.3 /100 | #191 | Fair 5.5% |
| Moroccans | 31.2 /100 | #192 | Fair 5.5% |
| Immigrants | Africa | 31.0 /100 | #193 | Fair 5.5% |
| Slavs | 30.9 /100 | #194 | Fair 5.5% |
| Finns | 30.7 /100 | #195 | Fair 5.5% |
| Immigrants | South America | 29.8 /100 | #196 | Fair 5.5% |
| Immigrants | Nicaragua | 28.9 /100 | #197 | Fair 5.5% |
| Immigrants | Afghanistan | 27.2 /100 | #198 | Fair 5.6% |
| Nicaraguans | 26.6 /100 | #199 | Fair 5.6% |
| Immigrants | Southern Europe | 25.8 /100 | #200 | Fair 5.6% |
| South American Indians | 24.4 /100 | #201 | Fair 5.6% |
| Immigrants | Germany | 22.9 /100 | #202 | Fair 5.6% |
| Koreans | 20.7 /100 | #203 | Fair 5.6% |
| Immigrants | Cameroon | 18.4 /100 | #204 | Poor 5.6% |
| Immigrants | Costa Rica | 14.4 /100 | #205 | Poor 5.6% |
Demographics Similar to Puget Sound Salish by Unemployment Among Ages 30 to 34 years
In terms of unemployment among ages 30 to 34 years, the demographic groups most similar to Puget Sound Salish are Turkish (5.1%, a difference of 0.030%), Immigrants from Burma/Myanmar (5.1%, a difference of 0.070%), Immigrants from Malaysia (5.1%, a difference of 0.080%), Cuban (5.1%, a difference of 0.12%), and Assyrian/Chaldean/Syriac (5.1%, a difference of 0.20%).
| Demographics | Rating | Rank | Unemployment Among Ages 30 to 34 years |
| Soviet Union | 98.8 /100 | #43 | Exceptional 5.0% |
| Immigrants | Belgium | 98.7 /100 | #44 | Exceptional 5.1% |
| Yugoslavians | 98.6 /100 | #45 | Exceptional 5.1% |
| Immigrants | Congo | 98.4 /100 | #46 | Exceptional 5.1% |
| Cypriots | 98.4 /100 | #47 | Exceptional 5.1% |
| Assyrians/Chaldeans/Syriacs | 98.4 /100 | #48 | Exceptional 5.1% |
| Immigrants | Malaysia | 98.3 /100 | #49 | Exceptional 5.1% |
| Puget Sound Salish | 98.2 /100 | #50 | Exceptional 5.1% |
| Turks | 98.2 /100 | #51 | Exceptional 5.1% |
| Immigrants | Burma/Myanmar | 98.1 /100 | #52 | Exceptional 5.1% |
| Cubans | 98.1 /100 | #53 | Exceptional 5.1% |
| Immigrants | Morocco | 97.9 /100 | #54 | Exceptional 5.1% |
| Chinese | 97.7 /100 | #55 | Exceptional 5.1% |
| Immigrants | Serbia | 97.4 /100 | #56 | Exceptional 5.1% |
| Immigrants | China | 97.2 /100 | #57 | Exceptional 5.1% |