Immigrants from Afghanistan vs Maltese In Labor Force | Age 30-34
COMPARE
Immigrants from Afghanistan
Maltese
In Labor Force | Age 30-34
In Labor Force | Age 30-34 Comparison
Immigrants from Afghanistan
Maltese
84.5%
IN LABOR FORCE | AGE 30-34
23.5/ 100
METRIC RATING
194th/ 347
METRIC RANK
85.4%
IN LABOR FORCE | AGE 30-34
99.0/ 100
METRIC RATING
74th/ 347
METRIC RANK
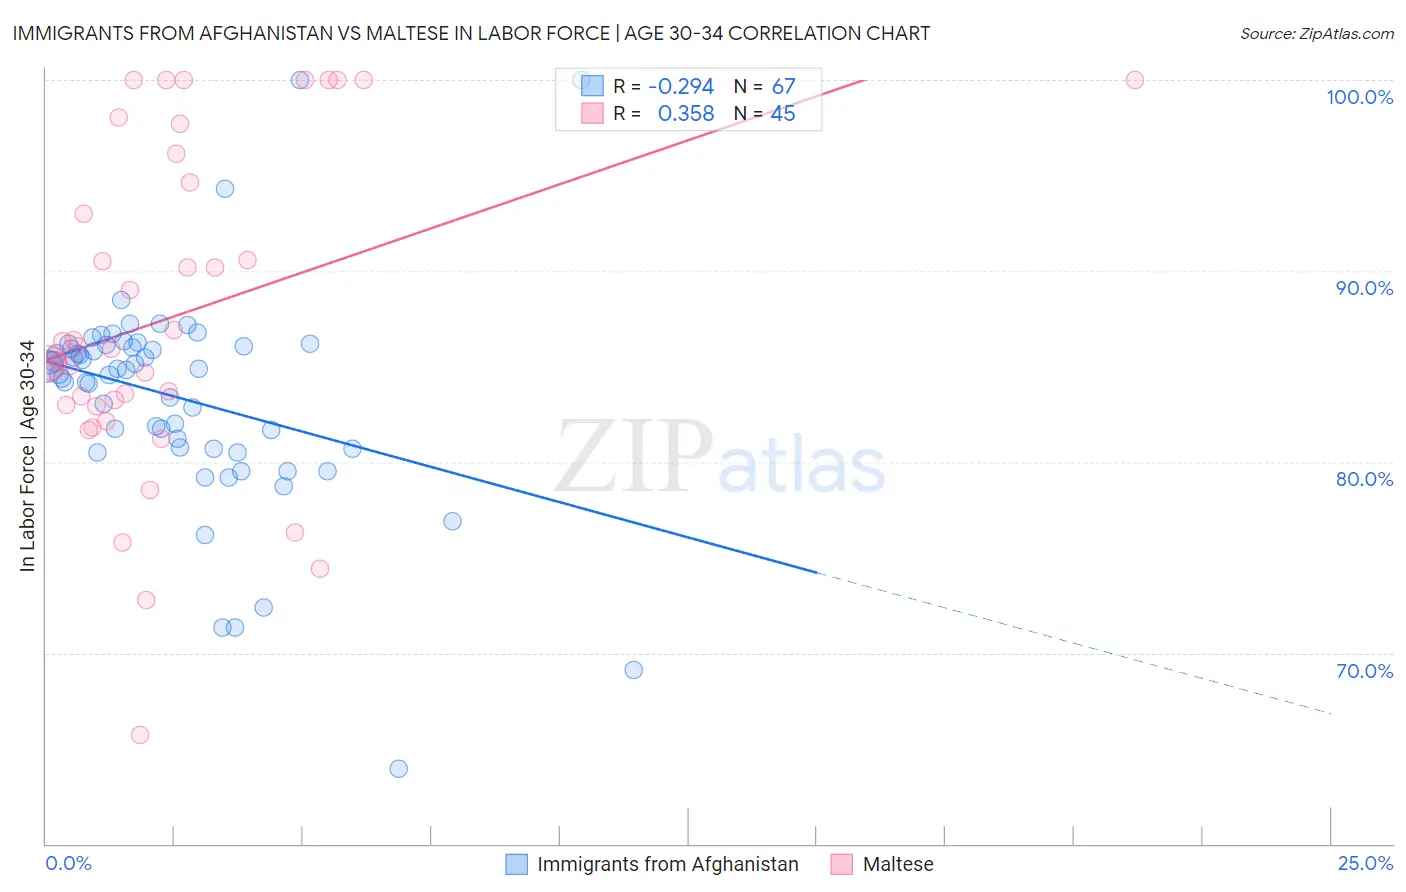
Immigrants from Afghanistan vs Maltese In Labor Force | Age 30-34 Correlation Chart
The statistical analysis conducted on geographies consisting of 147,638,034 people shows a weak negative correlation between the proportion of Immigrants from Afghanistan and labor force participation rate among population between the ages 30 and 34 in the United States with a correlation coefficient (R) of -0.294 and weighted average of 84.5%. Similarly, the statistical analysis conducted on geographies consisting of 126,441,405 people shows a mild positive correlation between the proportion of Maltese and labor force participation rate among population between the ages 30 and 34 in the United States with a correlation coefficient (R) of 0.358 and weighted average of 85.4%, a difference of 1.0%.
In Labor Force | Age 30-34 Correlation Summary
| Measurement | Immigrants from Afghanistan | Maltese |
| Minimum | 63.9% | 65.7% |
| Maximum | 100.0% | 100.0% |
| Range | 36.1% | 34.3% |
| Mean | 83.4% | 87.6% |
| Median | 84.8% | 85.9% |
| Interquartile 25% (IQ1) | 80.7% | 83.0% |
| Interquartile 75% (IQ3) | 86.0% | 95.4% |
| Interquartile Range (IQR) | 5.3% | 12.4% |
| Standard Deviation (Sample) | 5.7% | 8.5% |
| Standard Deviation (Population) | 5.7% | 8.4% |
Similar Demographics by In Labor Force | Age 30-34
Demographics Similar to Immigrants from Afghanistan by In Labor Force | Age 30-34
In terms of in labor force | age 30-34, the demographic groups most similar to Immigrants from Afghanistan are Immigrants from Costa Rica (84.5%, a difference of 0.0%), Korean (84.5%, a difference of 0.0%), Hungarian (84.5%, a difference of 0.010%), Scandinavian (84.5%, a difference of 0.010%), and British (84.5%, a difference of 0.010%).
| Demographics | Rating | Rank | In Labor Force | Age 30-34 |
| Costa Ricans | 29.6 /100 | #187 | Fair 84.6% |
| Taiwanese | 29.4 /100 | #188 | Fair 84.6% |
| Nigerians | 28.9 /100 | #189 | Fair 84.5% |
| Immigrants | Zaire | 25.8 /100 | #190 | Fair 84.5% |
| Hungarians | 24.8 /100 | #191 | Fair 84.5% |
| Scandinavians | 24.7 /100 | #192 | Fair 84.5% |
| Immigrants | Costa Rica | 23.9 /100 | #193 | Fair 84.5% |
| Immigrants | Afghanistan | 23.5 /100 | #194 | Fair 84.5% |
| Koreans | 23.2 /100 | #195 | Fair 84.5% |
| British | 22.9 /100 | #196 | Fair 84.5% |
| Immigrants | Syria | 21.9 /100 | #197 | Fair 84.5% |
| Dutch | 20.2 /100 | #198 | Fair 84.5% |
| Immigrants | Thailand | 19.1 /100 | #199 | Poor 84.5% |
| Sub-Saharan Africans | 19.0 /100 | #200 | Poor 84.5% |
| Trinidadians and Tobagonians | 18.2 /100 | #201 | Poor 84.5% |
Demographics Similar to Maltese by In Labor Force | Age 30-34
In terms of in labor force | age 30-34, the demographic groups most similar to Maltese are Immigrants from China (85.4%, a difference of 0.0%), Indian (Asian) (85.4%, a difference of 0.0%), Brazilian (85.4%, a difference of 0.010%), Immigrants from Japan (85.4%, a difference of 0.010%), and Immigrants from Czechoslovakia (85.4%, a difference of 0.010%).
| Demographics | Rating | Rank | In Labor Force | Age 30-34 |
| Kenyans | 99.3 /100 | #67 | Exceptional 85.4% |
| Immigrants | Eastern Europe | 99.3 /100 | #68 | Exceptional 85.4% |
| Immigrants | Iran | 99.2 /100 | #69 | Exceptional 85.4% |
| Brazilians | 99.1 /100 | #70 | Exceptional 85.4% |
| Immigrants | Japan | 99.1 /100 | #71 | Exceptional 85.4% |
| Immigrants | China | 99.0 /100 | #72 | Exceptional 85.4% |
| Indians (Asian) | 99.0 /100 | #73 | Exceptional 85.4% |
| Maltese | 99.0 /100 | #74 | Exceptional 85.4% |
| Immigrants | Czechoslovakia | 99.0 /100 | #75 | Exceptional 85.4% |
| Iranians | 99.0 /100 | #76 | Exceptional 85.4% |
| Immigrants | Eastern Asia | 98.9 /100 | #77 | Exceptional 85.4% |
| Immigrants | Singapore | 98.8 /100 | #78 | Exceptional 85.3% |
| Immigrants | Switzerland | 98.7 /100 | #79 | Exceptional 85.3% |
| Immigrants | Russia | 98.7 /100 | #80 | Exceptional 85.3% |
| Slovaks | 98.7 /100 | #81 | Exceptional 85.3% |