Immigrants from Afghanistan vs Portuguese In Labor Force | Age 30-34
COMPARE
Immigrants from Afghanistan
Portuguese
In Labor Force | Age 30-34
In Labor Force | Age 30-34 Comparison
Immigrants from Afghanistan
Portuguese
84.5%
IN LABOR FORCE | AGE 30-34
23.5/ 100
METRIC RATING
194th/ 347
METRIC RANK
84.0%
IN LABOR FORCE | AGE 30-34
0.8/ 100
METRIC RATING
248th/ 347
METRIC RANK
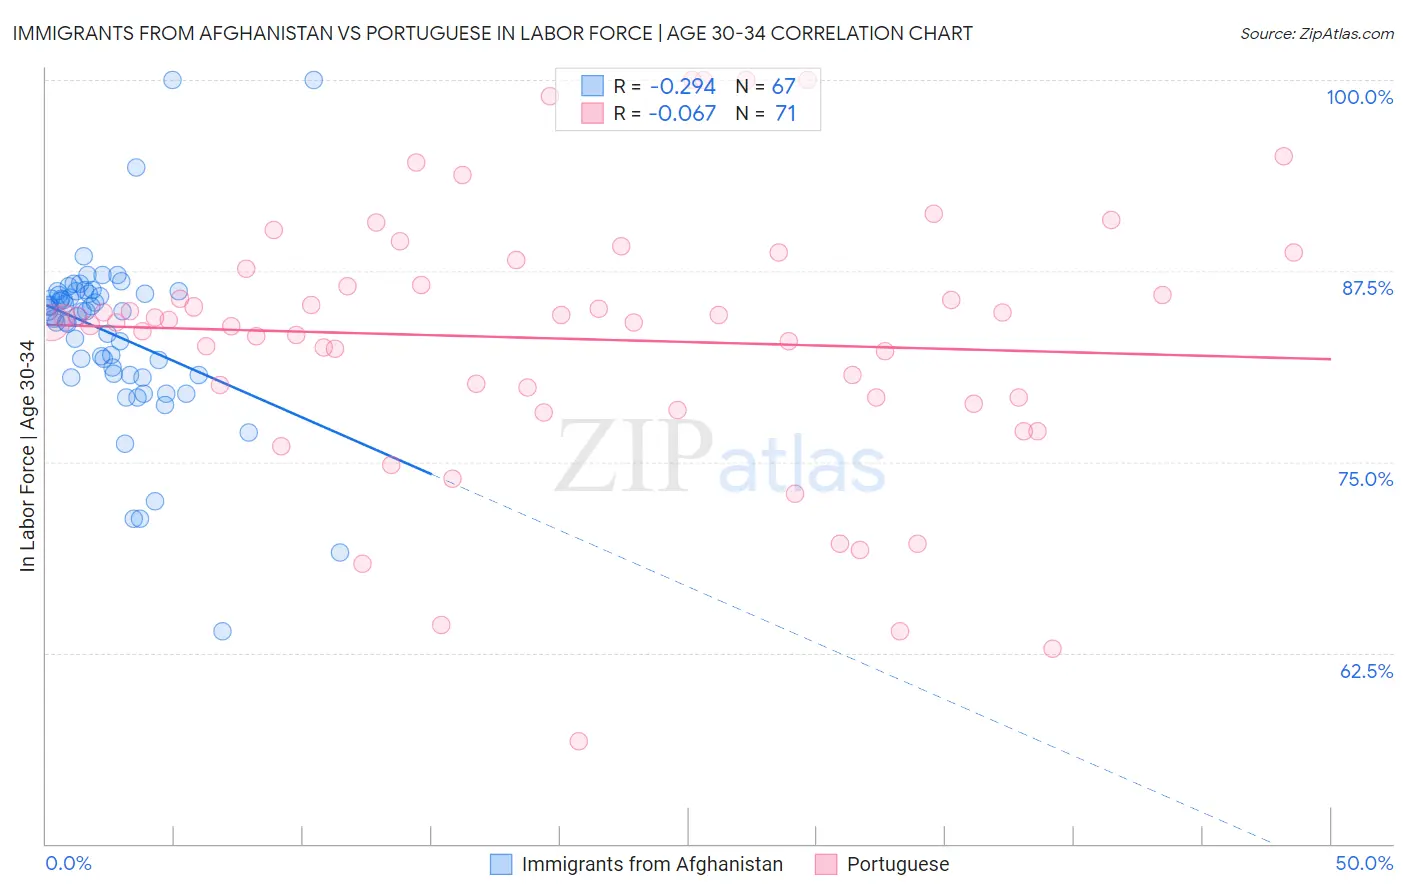
Immigrants from Afghanistan vs Portuguese In Labor Force | Age 30-34 Correlation Chart
The statistical analysis conducted on geographies consisting of 147,638,034 people shows a weak negative correlation between the proportion of Immigrants from Afghanistan and labor force participation rate among population between the ages 30 and 34 in the United States with a correlation coefficient (R) of -0.294 and weighted average of 84.5%. Similarly, the statistical analysis conducted on geographies consisting of 449,906,735 people shows a slight negative correlation between the proportion of Portuguese and labor force participation rate among population between the ages 30 and 34 in the United States with a correlation coefficient (R) of -0.067 and weighted average of 84.0%, a difference of 0.65%.
In Labor Force | Age 30-34 Correlation Summary
| Measurement | Immigrants from Afghanistan | Portuguese |
| Minimum | 63.9% | 56.7% |
| Maximum | 100.0% | 100.0% |
| Range | 36.1% | 43.3% |
| Mean | 83.4% | 83.1% |
| Median | 84.8% | 84.1% |
| Interquartile 25% (IQ1) | 80.7% | 79.2% |
| Interquartile 75% (IQ3) | 86.0% | 87.7% |
| Interquartile Range (IQR) | 5.3% | 8.5% |
| Standard Deviation (Sample) | 5.7% | 8.8% |
| Standard Deviation (Population) | 5.7% | 8.7% |
Similar Demographics by In Labor Force | Age 30-34
Demographics Similar to Immigrants from Afghanistan by In Labor Force | Age 30-34
In terms of in labor force | age 30-34, the demographic groups most similar to Immigrants from Afghanistan are Immigrants from Costa Rica (84.5%, a difference of 0.0%), Korean (84.5%, a difference of 0.0%), Hungarian (84.5%, a difference of 0.010%), Scandinavian (84.5%, a difference of 0.010%), and British (84.5%, a difference of 0.010%).
| Demographics | Rating | Rank | In Labor Force | Age 30-34 |
| Costa Ricans | 29.6 /100 | #187 | Fair 84.6% |
| Taiwanese | 29.4 /100 | #188 | Fair 84.6% |
| Nigerians | 28.9 /100 | #189 | Fair 84.5% |
| Immigrants | Zaire | 25.8 /100 | #190 | Fair 84.5% |
| Hungarians | 24.8 /100 | #191 | Fair 84.5% |
| Scandinavians | 24.7 /100 | #192 | Fair 84.5% |
| Immigrants | Costa Rica | 23.9 /100 | #193 | Fair 84.5% |
| Immigrants | Afghanistan | 23.5 /100 | #194 | Fair 84.5% |
| Koreans | 23.2 /100 | #195 | Fair 84.5% |
| British | 22.9 /100 | #196 | Fair 84.5% |
| Immigrants | Syria | 21.9 /100 | #197 | Fair 84.5% |
| Dutch | 20.2 /100 | #198 | Fair 84.5% |
| Immigrants | Thailand | 19.1 /100 | #199 | Poor 84.5% |
| Sub-Saharan Africans | 19.0 /100 | #200 | Poor 84.5% |
| Trinidadians and Tobagonians | 18.2 /100 | #201 | Poor 84.5% |
Demographics Similar to Portuguese by In Labor Force | Age 30-34
In terms of in labor force | age 30-34, the demographic groups most similar to Portuguese are Immigrants from Dominica (84.0%, a difference of 0.0%), British West Indian (84.0%, a difference of 0.010%), Immigrants from Iraq (83.9%, a difference of 0.020%), Basque (84.0%, a difference of 0.030%), and Immigrants from Venezuela (84.0%, a difference of 0.030%).
| Demographics | Rating | Rank | In Labor Force | Age 30-34 |
| Immigrants | Portugal | 1.2 /100 | #241 | Tragic 84.0% |
| Immigrants | Oceania | 1.1 /100 | #242 | Tragic 84.0% |
| Immigrants | Caribbean | 1.1 /100 | #243 | Tragic 84.0% |
| Basques | 0.9 /100 | #244 | Tragic 84.0% |
| Immigrants | Venezuela | 0.9 /100 | #245 | Tragic 84.0% |
| Central Americans | 0.9 /100 | #246 | Tragic 84.0% |
| British West Indians | 0.8 /100 | #247 | Tragic 84.0% |
| Portuguese | 0.8 /100 | #248 | Tragic 84.0% |
| Immigrants | Dominica | 0.7 /100 | #249 | Tragic 84.0% |
| Immigrants | Iraq | 0.7 /100 | #250 | Tragic 83.9% |
| Nicaraguans | 0.6 /100 | #251 | Tragic 83.9% |
| Bahamians | 0.6 /100 | #252 | Tragic 83.9% |
| Immigrants | Nicaragua | 0.6 /100 | #253 | Tragic 83.9% |
| Immigrants | St. Vincent and the Grenadines | 0.5 /100 | #254 | Tragic 83.9% |
| Whites/Caucasians | 0.5 /100 | #255 | Tragic 83.9% |