Immigrants from Afghanistan vs Native Hawaiian In Labor Force | Age 20-24
COMPARE
Immigrants from Afghanistan
Native Hawaiian
In Labor Force | Age 20-24
In Labor Force | Age 20-24 Comparison
Immigrants from Afghanistan
Native Hawaiians
75.6%
IN LABOR FORCE | AGE 20-24
89.4/ 100
METRIC RATING
128th/ 347
METRIC RANK
77.4%
IN LABOR FORCE | AGE 20-24
100.0/ 100
METRIC RATING
45th/ 347
METRIC RANK
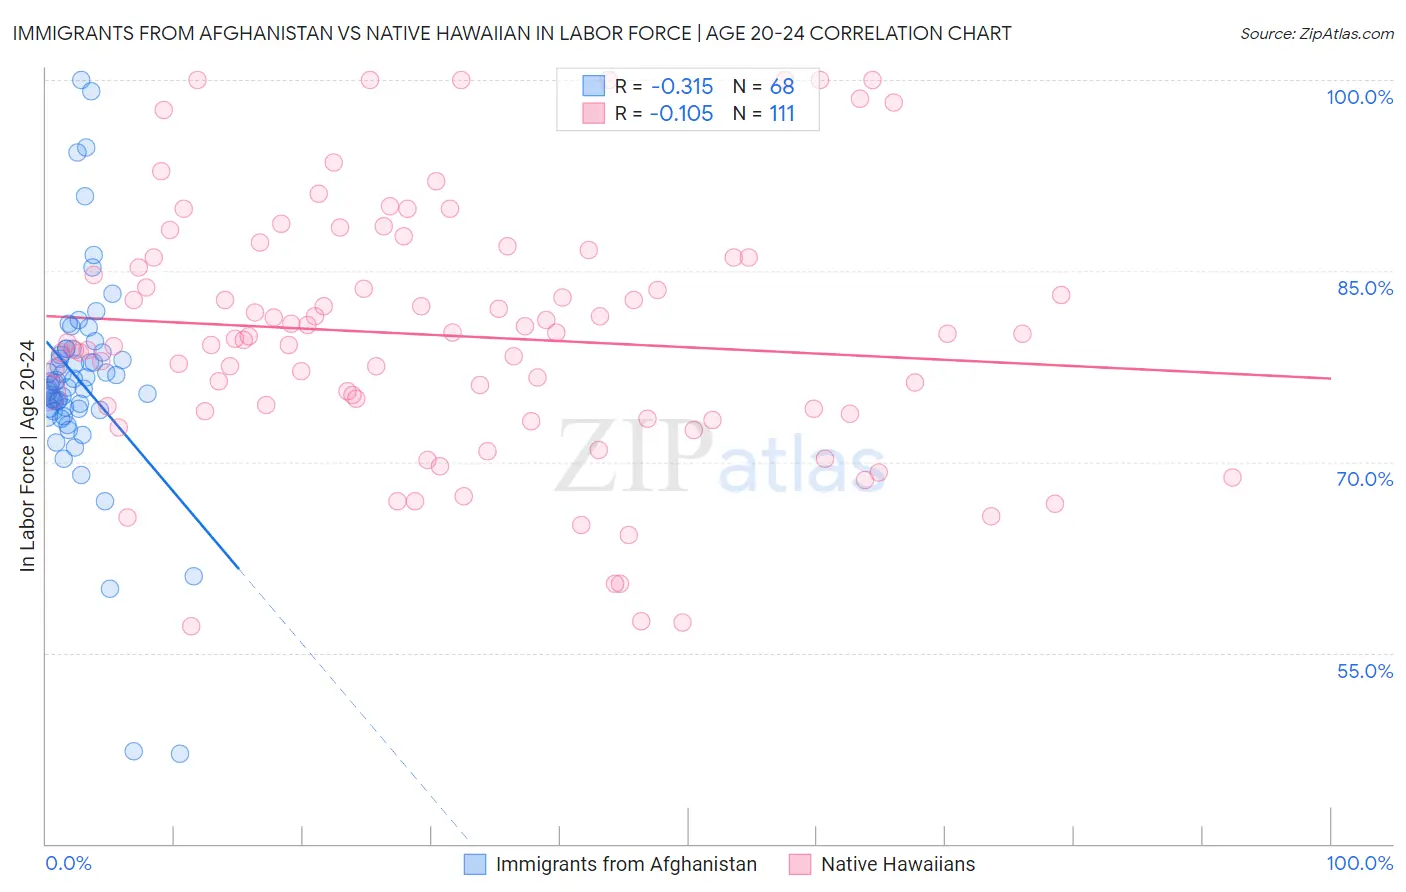
Immigrants from Afghanistan vs Native Hawaiian In Labor Force | Age 20-24 Correlation Chart
The statistical analysis conducted on geographies consisting of 147,610,096 people shows a mild negative correlation between the proportion of Immigrants from Afghanistan and labor force participation rate among population between the ages 20 and 24 in the United States with a correlation coefficient (R) of -0.315 and weighted average of 75.6%. Similarly, the statistical analysis conducted on geographies consisting of 331,991,642 people shows a poor negative correlation between the proportion of Native Hawaiians and labor force participation rate among population between the ages 20 and 24 in the United States with a correlation coefficient (R) of -0.105 and weighted average of 77.4%, a difference of 2.3%.
In Labor Force | Age 20-24 Correlation Summary
| Measurement | Immigrants from Afghanistan | Native Hawaiian |
| Minimum | 47.1% | 57.1% |
| Maximum | 100.0% | 100.0% |
| Range | 52.9% | 42.9% |
| Mean | 76.4% | 79.9% |
| Median | 76.2% | 79.6% |
| Interquartile 25% (IQ1) | 74.2% | 74.0% |
| Interquartile 75% (IQ3) | 78.7% | 86.1% |
| Interquartile Range (IQR) | 4.6% | 12.1% |
| Standard Deviation (Sample) | 8.5% | 9.9% |
| Standard Deviation (Population) | 8.5% | 9.9% |
Similar Demographics by In Labor Force | Age 20-24
Demographics Similar to Immigrants from Afghanistan by In Labor Force | Age 20-24
In terms of in labor force | age 20-24, the demographic groups most similar to Immigrants from Afghanistan are Iroquois (75.6%, a difference of 0.010%), Immigrants from Austria (75.6%, a difference of 0.020%), Immigrants from Jordan (75.6%, a difference of 0.030%), Palestinian (75.6%, a difference of 0.040%), and Zimbabwean (75.6%, a difference of 0.040%).
| Demographics | Rating | Rank | In Labor Force | Age 20-24 |
| Immigrants | Serbia | 94.3 /100 | #121 | Exceptional 75.8% |
| Pakistanis | 94.1 /100 | #122 | Exceptional 75.8% |
| Immigrants | Bulgaria | 94.1 /100 | #123 | Exceptional 75.8% |
| Immigrants | Sierra Leone | 93.8 /100 | #124 | Exceptional 75.8% |
| Immigrants | Scotland | 93.7 /100 | #125 | Exceptional 75.8% |
| Brazilians | 93.0 /100 | #126 | Exceptional 75.8% |
| Sub-Saharan Africans | 90.9 /100 | #127 | Exceptional 75.7% |
| Immigrants | Afghanistan | 89.4 /100 | #128 | Excellent 75.6% |
| Iroquois | 89.1 /100 | #129 | Excellent 75.6% |
| Immigrants | Austria | 88.8 /100 | #130 | Excellent 75.6% |
| Immigrants | Jordan | 88.5 /100 | #131 | Excellent 75.6% |
| Palestinians | 88.4 /100 | #132 | Excellent 75.6% |
| Zimbabweans | 88.2 /100 | #133 | Excellent 75.6% |
| Estonians | 87.1 /100 | #134 | Excellent 75.6% |
| Yaqui | 85.5 /100 | #135 | Excellent 75.5% |
Demographics Similar to Native Hawaiians by In Labor Force | Age 20-24
In terms of in labor force | age 20-24, the demographic groups most similar to Native Hawaiians are Fijian (77.4%, a difference of 0.010%), Samoan (77.4%, a difference of 0.010%), Immigrants from Laos (77.4%, a difference of 0.020%), French (77.4%, a difference of 0.030%), and Immigrants from Congo (77.4%, a difference of 0.040%).
| Demographics | Rating | Rank | In Labor Force | Age 20-24 |
| Marshallese | 100.0 /100 | #38 | Exceptional 77.4% |
| Irish | 100.0 /100 | #39 | Exceptional 77.4% |
| Scottish | 100.0 /100 | #40 | Exceptional 77.4% |
| Immigrants | Congo | 100.0 /100 | #41 | Exceptional 77.4% |
| French | 100.0 /100 | #42 | Exceptional 77.4% |
| Immigrants | Laos | 100.0 /100 | #43 | Exceptional 77.4% |
| Fijians | 100.0 /100 | #44 | Exceptional 77.4% |
| Native Hawaiians | 100.0 /100 | #45 | Exceptional 77.4% |
| Samoans | 100.0 /100 | #46 | Exceptional 77.4% |
| Ethiopians | 100.0 /100 | #47 | Exceptional 77.3% |
| Serbians | 100.0 /100 | #48 | Exceptional 77.3% |
| Chinese | 100.0 /100 | #49 | Exceptional 77.3% |
| Malaysians | 100.0 /100 | #50 | Exceptional 77.2% |
| Croatians | 100.0 /100 | #51 | Exceptional 77.2% |
| Indonesians | 100.0 /100 | #52 | Exceptional 77.2% |