Cree vs Native Hawaiian In Labor Force | Age 20-24
COMPARE
Cree
Native Hawaiian
In Labor Force | Age 20-24
In Labor Force | Age 20-24 Comparison
Cree
Native Hawaiians
76.6%
IN LABOR FORCE | AGE 20-24
99.7/ 100
METRIC RATING
74th/ 347
METRIC RANK
77.4%
IN LABOR FORCE | AGE 20-24
100.0/ 100
METRIC RATING
45th/ 347
METRIC RANK
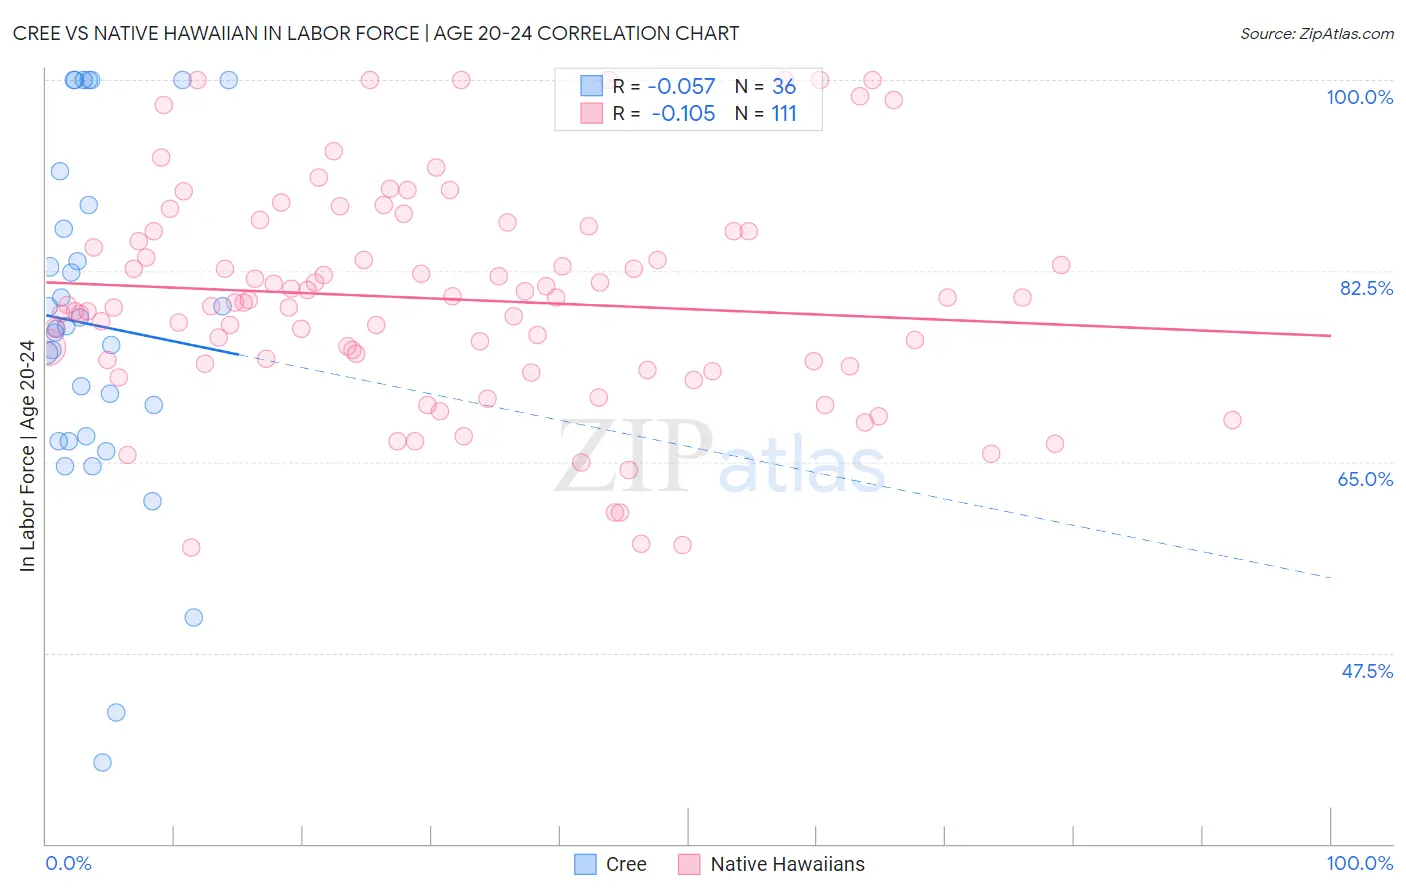
Cree vs Native Hawaiian In Labor Force | Age 20-24 Correlation Chart
The statistical analysis conducted on geographies consisting of 76,182,817 people shows a slight negative correlation between the proportion of Cree and labor force participation rate among population between the ages 20 and 24 in the United States with a correlation coefficient (R) of -0.057 and weighted average of 76.6%. Similarly, the statistical analysis conducted on geographies consisting of 331,991,642 people shows a poor negative correlation between the proportion of Native Hawaiians and labor force participation rate among population between the ages 20 and 24 in the United States with a correlation coefficient (R) of -0.105 and weighted average of 77.4%, a difference of 0.93%.
In Labor Force | Age 20-24 Correlation Summary
| Measurement | Cree | Native Hawaiian |
| Minimum | 37.5% | 57.1% |
| Maximum | 100.0% | 100.0% |
| Range | 62.5% | 42.9% |
| Mean | 77.5% | 79.9% |
| Median | 77.3% | 79.6% |
| Interquartile 25% (IQ1) | 67.1% | 74.0% |
| Interquartile 75% (IQ3) | 87.4% | 86.1% |
| Interquartile Range (IQR) | 20.4% | 12.1% |
| Standard Deviation (Sample) | 15.9% | 9.9% |
| Standard Deviation (Population) | 15.6% | 9.9% |
Similar Demographics by In Labor Force | Age 20-24
Demographics Similar to Cree by In Labor Force | Age 20-24
In terms of in labor force | age 20-24, the demographic groups most similar to Cree are Immigrants from Middle Africa (76.6%, a difference of 0.020%), Immigrants from Moldova (76.6%, a difference of 0.060%), British (76.7%, a difference of 0.070%), Immigrants from Cameroon (76.6%, a difference of 0.090%), and Canadian (76.6%, a difference of 0.090%).
| Demographics | Rating | Rank | In Labor Force | Age 20-24 |
| Slavs | 99.9 /100 | #67 | Exceptional 76.9% |
| French American Indians | 99.8 /100 | #68 | Exceptional 76.8% |
| Immigrants | Sudan | 99.8 /100 | #69 | Exceptional 76.8% |
| Ottawa | 99.8 /100 | #70 | Exceptional 76.8% |
| Northern Europeans | 99.8 /100 | #71 | Exceptional 76.8% |
| Guamanians/Chamorros | 99.8 /100 | #72 | Exceptional 76.7% |
| British | 99.8 /100 | #73 | Exceptional 76.7% |
| Cree | 99.7 /100 | #74 | Exceptional 76.6% |
| Immigrants | Middle Africa | 99.7 /100 | #75 | Exceptional 76.6% |
| Immigrants | Moldova | 99.6 /100 | #76 | Exceptional 76.6% |
| Immigrants | Cameroon | 99.6 /100 | #77 | Exceptional 76.6% |
| Canadians | 99.6 /100 | #78 | Exceptional 76.6% |
| Immigrants | Zaire | 99.6 /100 | #79 | Exceptional 76.6% |
| Italians | 99.6 /100 | #80 | Exceptional 76.5% |
| Basques | 99.5 /100 | #81 | Exceptional 76.5% |
Demographics Similar to Native Hawaiians by In Labor Force | Age 20-24
In terms of in labor force | age 20-24, the demographic groups most similar to Native Hawaiians are Fijian (77.4%, a difference of 0.010%), Samoan (77.4%, a difference of 0.010%), Immigrants from Laos (77.4%, a difference of 0.020%), French (77.4%, a difference of 0.030%), and Immigrants from Congo (77.4%, a difference of 0.040%).
| Demographics | Rating | Rank | In Labor Force | Age 20-24 |
| Marshallese | 100.0 /100 | #38 | Exceptional 77.4% |
| Irish | 100.0 /100 | #39 | Exceptional 77.4% |
| Scottish | 100.0 /100 | #40 | Exceptional 77.4% |
| Immigrants | Congo | 100.0 /100 | #41 | Exceptional 77.4% |
| French | 100.0 /100 | #42 | Exceptional 77.4% |
| Immigrants | Laos | 100.0 /100 | #43 | Exceptional 77.4% |
| Fijians | 100.0 /100 | #44 | Exceptional 77.4% |
| Native Hawaiians | 100.0 /100 | #45 | Exceptional 77.4% |
| Samoans | 100.0 /100 | #46 | Exceptional 77.4% |
| Ethiopians | 100.0 /100 | #47 | Exceptional 77.3% |
| Serbians | 100.0 /100 | #48 | Exceptional 77.3% |
| Chinese | 100.0 /100 | #49 | Exceptional 77.3% |
| Malaysians | 100.0 /100 | #50 | Exceptional 77.2% |
| Croatians | 100.0 /100 | #51 | Exceptional 77.2% |
| Indonesians | 100.0 /100 | #52 | Exceptional 77.2% |