Immigrants from Afghanistan vs Native Hawaiian 2nd Grade
COMPARE
Immigrants from Afghanistan
Native Hawaiian
2nd Grade
2nd Grade Comparison
Immigrants from Afghanistan
Native Hawaiians
97.2%
2ND GRADE
0.0/ 100
METRIC RATING
291st/ 347
METRIC RANK
98.4%
2ND GRADE
99.9/ 100
METRIC RATING
42nd/ 347
METRIC RANK
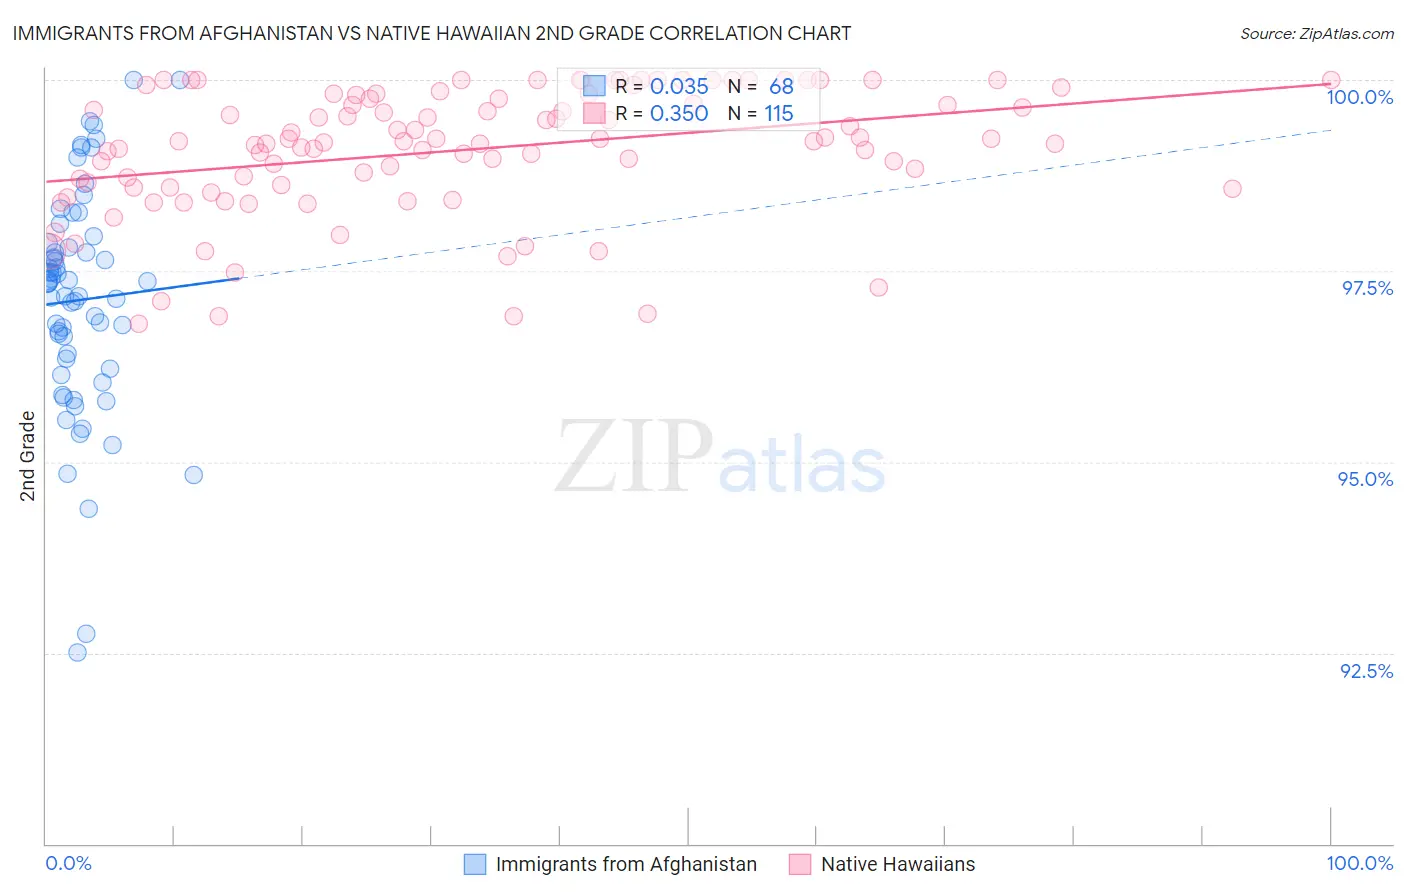
Immigrants from Afghanistan vs Native Hawaiian 2nd Grade Correlation Chart
The statistical analysis conducted on geographies consisting of 147,629,924 people shows no correlation between the proportion of Immigrants from Afghanistan and percentage of population with at least 2nd grade education in the United States with a correlation coefficient (R) of 0.035 and weighted average of 97.2%. Similarly, the statistical analysis conducted on geographies consisting of 332,114,626 people shows a mild positive correlation between the proportion of Native Hawaiians and percentage of population with at least 2nd grade education in the United States with a correlation coefficient (R) of 0.350 and weighted average of 98.4%, a difference of 1.3%.
2nd Grade Correlation Summary
| Measurement | Immigrants from Afghanistan | Native Hawaiian |
| Minimum | 92.5% | 96.8% |
| Maximum | 100.0% | 100.0% |
| Range | 7.5% | 3.2% |
| Mean | 97.1% | 99.1% |
| Median | 97.3% | 99.2% |
| Interquartile 25% (IQ1) | 96.3% | 98.6% |
| Interquartile 75% (IQ3) | 97.8% | 99.8% |
| Interquartile Range (IQR) | 1.6% | 1.2% |
| Standard Deviation (Sample) | 1.5% | 0.82% |
| Standard Deviation (Population) | 1.5% | 0.81% |
Similar Demographics by 2nd Grade
Demographics Similar to Immigrants from Afghanistan by 2nd Grade
In terms of 2nd grade, the demographic groups most similar to Immigrants from Afghanistan are Immigrants from St. Vincent and the Grenadines (97.2%, a difference of 0.0%), Houma (97.2%, a difference of 0.010%), Immigrants from Thailand (97.2%, a difference of 0.020%), Immigrants from Eritrea (97.2%, a difference of 0.020%), and Immigrants from Hong Kong (97.2%, a difference of 0.030%).
| Demographics | Rating | Rank | 2nd Grade |
| Immigrants | West Indies | 0.0 /100 | #284 | Tragic 97.2% |
| Immigrants | Hong Kong | 0.0 /100 | #285 | Tragic 97.2% |
| Immigrants | Barbados | 0.0 /100 | #286 | Tragic 97.2% |
| Immigrants | Portugal | 0.0 /100 | #287 | Tragic 97.2% |
| Immigrants | Thailand | 0.0 /100 | #288 | Tragic 97.2% |
| Houma | 0.0 /100 | #289 | Tragic 97.2% |
| Immigrants | St. Vincent and the Grenadines | 0.0 /100 | #290 | Tragic 97.2% |
| Immigrants | Afghanistan | 0.0 /100 | #291 | Tragic 97.2% |
| Immigrants | Eritrea | 0.0 /100 | #292 | Tragic 97.2% |
| British West Indians | 0.0 /100 | #293 | Tragic 97.2% |
| Malaysians | 0.0 /100 | #294 | Tragic 97.1% |
| Immigrants | Grenada | 0.0 /100 | #295 | Tragic 97.1% |
| Immigrants | Immigrants | 0.0 /100 | #296 | Tragic 97.1% |
| Immigrants | Cuba | 0.0 /100 | #297 | Tragic 97.0% |
| Immigrants | Dominica | 0.0 /100 | #298 | Tragic 97.0% |
Demographics Similar to Native Hawaiians by 2nd Grade
In terms of 2nd grade, the demographic groups most similar to Native Hawaiians are Belgian (98.4%, a difference of 0.0%), Northern European (98.4%, a difference of 0.0%), Luxembourger (98.4%, a difference of 0.010%), Eastern European (98.4%, a difference of 0.010%), and Latvian (98.4%, a difference of 0.020%).
| Demographics | Rating | Rank | 2nd Grade |
| Swiss | 100.0 /100 | #35 | Exceptional 98.5% |
| British | 100.0 /100 | #36 | Exceptional 98.5% |
| Italians | 99.9 /100 | #37 | Exceptional 98.4% |
| Latvians | 99.9 /100 | #38 | Exceptional 98.4% |
| Chippewa | 99.9 /100 | #39 | Exceptional 98.4% |
| Luxembourgers | 99.9 /100 | #40 | Exceptional 98.4% |
| Eastern Europeans | 99.9 /100 | #41 | Exceptional 98.4% |
| Native Hawaiians | 99.9 /100 | #42 | Exceptional 98.4% |
| Belgians | 99.9 /100 | #43 | Exceptional 98.4% |
| Northern Europeans | 99.9 /100 | #44 | Exceptional 98.4% |
| Hungarians | 99.9 /100 | #45 | Exceptional 98.4% |
| Lumbee | 99.9 /100 | #46 | Exceptional 98.4% |
| Ottawa | 99.9 /100 | #47 | Exceptional 98.4% |
| Czechoslovakians | 99.9 /100 | #48 | Exceptional 98.4% |
| Celtics | 99.8 /100 | #49 | Exceptional 98.4% |