Immigrants from Central America vs Maltese In Labor Force | Age 30-34
COMPARE
Immigrants from Central America
Maltese
In Labor Force | Age 30-34
In Labor Force | Age 30-34 Comparison
Immigrants from Central America
Maltese
82.5%
IN LABOR FORCE | AGE 30-34
0.0/ 100
METRIC RATING
299th/ 347
METRIC RANK
85.4%
IN LABOR FORCE | AGE 30-34
99.0/ 100
METRIC RATING
74th/ 347
METRIC RANK
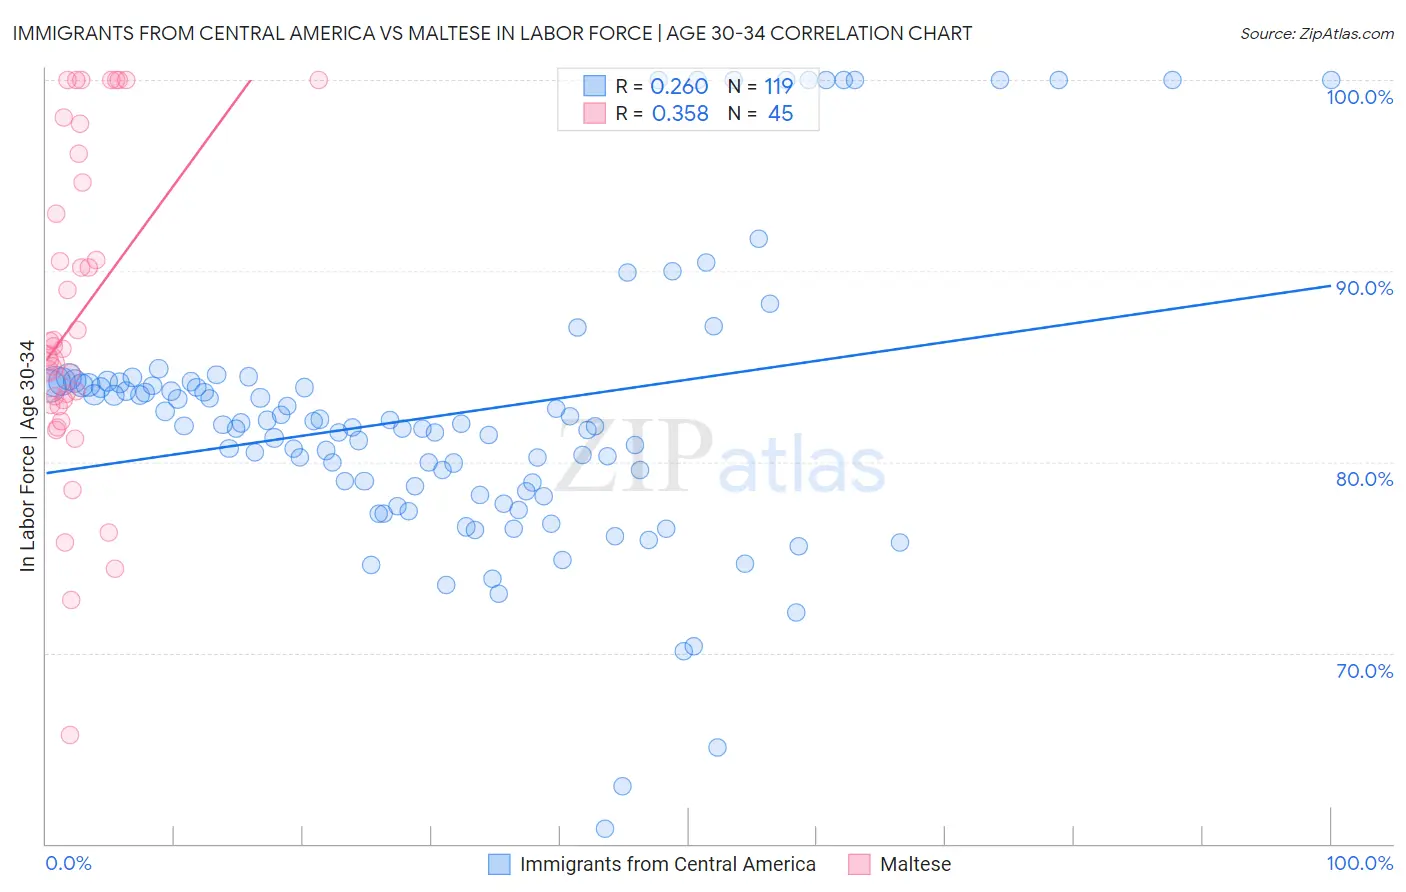
Immigrants from Central America vs Maltese In Labor Force | Age 30-34 Correlation Chart
The statistical analysis conducted on geographies consisting of 535,746,128 people shows a weak positive correlation between the proportion of Immigrants from Central America and labor force participation rate among population between the ages 30 and 34 in the United States with a correlation coefficient (R) of 0.260 and weighted average of 82.5%. Similarly, the statistical analysis conducted on geographies consisting of 126,441,405 people shows a mild positive correlation between the proportion of Maltese and labor force participation rate among population between the ages 30 and 34 in the United States with a correlation coefficient (R) of 0.358 and weighted average of 85.4%, a difference of 3.5%.
In Labor Force | Age 30-34 Correlation Summary
| Measurement | Immigrants from Central America | Maltese |
| Minimum | 60.8% | 65.7% |
| Maximum | 100.0% | 100.0% |
| Range | 39.2% | 34.3% |
| Mean | 82.5% | 87.6% |
| Median | 81.9% | 85.9% |
| Interquartile 25% (IQ1) | 78.4% | 83.0% |
| Interquartile 75% (IQ3) | 84.1% | 95.4% |
| Interquartile Range (IQR) | 5.7% | 12.4% |
| Standard Deviation (Sample) | 7.6% | 8.5% |
| Standard Deviation (Population) | 7.5% | 8.4% |
Similar Demographics by In Labor Force | Age 30-34
Demographics Similar to Immigrants from Central America by In Labor Force | Age 30-34
In terms of in labor force | age 30-34, the demographic groups most similar to Immigrants from Central America are Hmong (82.4%, a difference of 0.060%), Hispanic or Latino (82.4%, a difference of 0.070%), Ottawa (82.4%, a difference of 0.10%), Immigrants from Micronesia (82.4%, a difference of 0.11%), and Comanche (82.6%, a difference of 0.13%).
| Demographics | Rating | Rank | In Labor Force | Age 30-34 |
| Blacks/African Americans | 0.0 /100 | #292 | Tragic 82.8% |
| Nepalese | 0.0 /100 | #293 | Tragic 82.7% |
| Americans | 0.0 /100 | #294 | Tragic 82.7% |
| Pennsylvania Germans | 0.0 /100 | #295 | Tragic 82.6% |
| Chippewa | 0.0 /100 | #296 | Tragic 82.6% |
| Comanche | 0.0 /100 | #297 | Tragic 82.6% |
| Aleuts | 0.0 /100 | #298 | Tragic 82.6% |
| Immigrants | Central America | 0.0 /100 | #299 | Tragic 82.5% |
| Hmong | 0.0 /100 | #300 | Tragic 82.4% |
| Hispanics or Latinos | 0.0 /100 | #301 | Tragic 82.4% |
| Ottawa | 0.0 /100 | #302 | Tragic 82.4% |
| Immigrants | Micronesia | 0.0 /100 | #303 | Tragic 82.4% |
| Tlingit-Haida | 0.0 /100 | #304 | Tragic 82.3% |
| Osage | 0.0 /100 | #305 | Tragic 82.3% |
| Spanish American Indians | 0.0 /100 | #306 | Tragic 82.2% |
Demographics Similar to Maltese by In Labor Force | Age 30-34
In terms of in labor force | age 30-34, the demographic groups most similar to Maltese are Immigrants from China (85.4%, a difference of 0.0%), Indian (Asian) (85.4%, a difference of 0.0%), Brazilian (85.4%, a difference of 0.010%), Immigrants from Japan (85.4%, a difference of 0.010%), and Immigrants from Czechoslovakia (85.4%, a difference of 0.010%).
| Demographics | Rating | Rank | In Labor Force | Age 30-34 |
| Kenyans | 99.3 /100 | #67 | Exceptional 85.4% |
| Immigrants | Eastern Europe | 99.3 /100 | #68 | Exceptional 85.4% |
| Immigrants | Iran | 99.2 /100 | #69 | Exceptional 85.4% |
| Brazilians | 99.1 /100 | #70 | Exceptional 85.4% |
| Immigrants | Japan | 99.1 /100 | #71 | Exceptional 85.4% |
| Immigrants | China | 99.0 /100 | #72 | Exceptional 85.4% |
| Indians (Asian) | 99.0 /100 | #73 | Exceptional 85.4% |
| Maltese | 99.0 /100 | #74 | Exceptional 85.4% |
| Immigrants | Czechoslovakia | 99.0 /100 | #75 | Exceptional 85.4% |
| Iranians | 99.0 /100 | #76 | Exceptional 85.4% |
| Immigrants | Eastern Asia | 98.9 /100 | #77 | Exceptional 85.4% |
| Immigrants | Singapore | 98.8 /100 | #78 | Exceptional 85.3% |
| Immigrants | Switzerland | 98.7 /100 | #79 | Exceptional 85.3% |
| Immigrants | Russia | 98.7 /100 | #80 | Exceptional 85.3% |
| Slovaks | 98.7 /100 | #81 | Exceptional 85.3% |