White/Caucasian vs Maltese In Labor Force | Age 30-34
COMPARE
White/Caucasian
Maltese
In Labor Force | Age 30-34
In Labor Force | Age 30-34 Comparison
Whites/Caucasians
Maltese
83.9%
IN LABOR FORCE | AGE 30-34
0.5/ 100
METRIC RATING
255th/ 347
METRIC RANK
85.4%
IN LABOR FORCE | AGE 30-34
99.0/ 100
METRIC RATING
74th/ 347
METRIC RANK
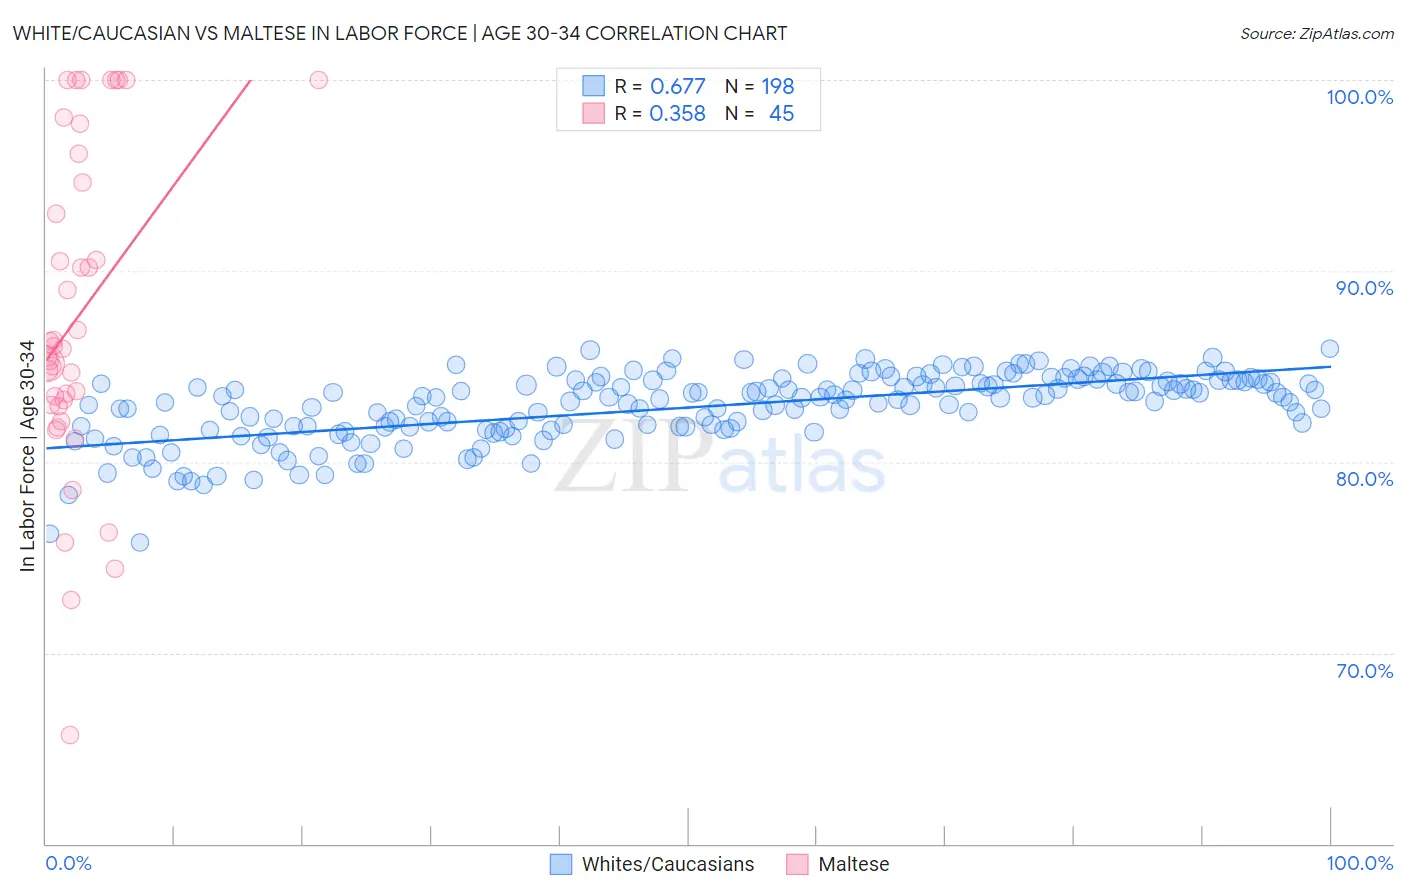
White/Caucasian vs Maltese In Labor Force | Age 30-34 Correlation Chart
The statistical analysis conducted on geographies consisting of 582,394,774 people shows a significant positive correlation between the proportion of Whites/Caucasians and labor force participation rate among population between the ages 30 and 34 in the United States with a correlation coefficient (R) of 0.677 and weighted average of 83.9%. Similarly, the statistical analysis conducted on geographies consisting of 126,441,405 people shows a mild positive correlation between the proportion of Maltese and labor force participation rate among population between the ages 30 and 34 in the United States with a correlation coefficient (R) of 0.358 and weighted average of 85.4%, a difference of 1.8%.
In Labor Force | Age 30-34 Correlation Summary
| Measurement | White/Caucasian | Maltese |
| Minimum | 75.8% | 65.7% |
| Maximum | 85.9% | 100.0% |
| Range | 10.2% | 34.3% |
| Mean | 82.9% | 87.6% |
| Median | 83.4% | 85.9% |
| Interquartile 25% (IQ1) | 81.8% | 83.0% |
| Interquartile 75% (IQ3) | 84.2% | 95.4% |
| Interquartile Range (IQR) | 2.4% | 12.4% |
| Standard Deviation (Sample) | 1.8% | 8.5% |
| Standard Deviation (Population) | 1.8% | 8.4% |
Similar Demographics by In Labor Force | Age 30-34
Demographics Similar to Whites/Caucasians by In Labor Force | Age 30-34
In terms of in labor force | age 30-34, the demographic groups most similar to Whites/Caucasians are Immigrants from St. Vincent and the Grenadines (83.9%, a difference of 0.020%), Nicaraguan (83.9%, a difference of 0.040%), Bahamian (83.9%, a difference of 0.040%), Immigrants from Nicaragua (83.9%, a difference of 0.040%), and Immigrants from Lebanon (83.9%, a difference of 0.040%).
| Demographics | Rating | Rank | In Labor Force | Age 30-34 |
| Portuguese | 0.8 /100 | #248 | Tragic 84.0% |
| Immigrants | Dominica | 0.7 /100 | #249 | Tragic 84.0% |
| Immigrants | Iraq | 0.7 /100 | #250 | Tragic 83.9% |
| Nicaraguans | 0.6 /100 | #251 | Tragic 83.9% |
| Bahamians | 0.6 /100 | #252 | Tragic 83.9% |
| Immigrants | Nicaragua | 0.6 /100 | #253 | Tragic 83.9% |
| Immigrants | St. Vincent and the Grenadines | 0.5 /100 | #254 | Tragic 83.9% |
| Whites/Caucasians | 0.5 /100 | #255 | Tragic 83.9% |
| Immigrants | Lebanon | 0.4 /100 | #256 | Tragic 83.9% |
| Iraqis | 0.3 /100 | #257 | Tragic 83.8% |
| Hondurans | 0.3 /100 | #258 | Tragic 83.8% |
| Scotch-Irish | 0.3 /100 | #259 | Tragic 83.8% |
| Immigrants | Dominican Republic | 0.3 /100 | #260 | Tragic 83.8% |
| Guyanese | 0.3 /100 | #261 | Tragic 83.8% |
| Dominicans | 0.2 /100 | #262 | Tragic 83.8% |
Demographics Similar to Maltese by In Labor Force | Age 30-34
In terms of in labor force | age 30-34, the demographic groups most similar to Maltese are Immigrants from China (85.4%, a difference of 0.0%), Indian (Asian) (85.4%, a difference of 0.0%), Brazilian (85.4%, a difference of 0.010%), Immigrants from Japan (85.4%, a difference of 0.010%), and Immigrants from Czechoslovakia (85.4%, a difference of 0.010%).
| Demographics | Rating | Rank | In Labor Force | Age 30-34 |
| Kenyans | 99.3 /100 | #67 | Exceptional 85.4% |
| Immigrants | Eastern Europe | 99.3 /100 | #68 | Exceptional 85.4% |
| Immigrants | Iran | 99.2 /100 | #69 | Exceptional 85.4% |
| Brazilians | 99.1 /100 | #70 | Exceptional 85.4% |
| Immigrants | Japan | 99.1 /100 | #71 | Exceptional 85.4% |
| Immigrants | China | 99.0 /100 | #72 | Exceptional 85.4% |
| Indians (Asian) | 99.0 /100 | #73 | Exceptional 85.4% |
| Maltese | 99.0 /100 | #74 | Exceptional 85.4% |
| Immigrants | Czechoslovakia | 99.0 /100 | #75 | Exceptional 85.4% |
| Iranians | 99.0 /100 | #76 | Exceptional 85.4% |
| Immigrants | Eastern Asia | 98.9 /100 | #77 | Exceptional 85.4% |
| Immigrants | Singapore | 98.8 /100 | #78 | Exceptional 85.3% |
| Immigrants | Switzerland | 98.7 /100 | #79 | Exceptional 85.3% |
| Immigrants | Russia | 98.7 /100 | #80 | Exceptional 85.3% |
| Slovaks | 98.7 /100 | #81 | Exceptional 85.3% |