Immigrants from Indonesia vs Maltese In Labor Force | Age 30-34
COMPARE
Immigrants from Indonesia
Maltese
In Labor Force | Age 30-34
In Labor Force | Age 30-34 Comparison
Immigrants from Indonesia
Maltese
84.9%
IN LABOR FORCE | AGE 30-34
84.3/ 100
METRIC RATING
142nd/ 347
METRIC RANK
85.4%
IN LABOR FORCE | AGE 30-34
99.0/ 100
METRIC RATING
74th/ 347
METRIC RANK
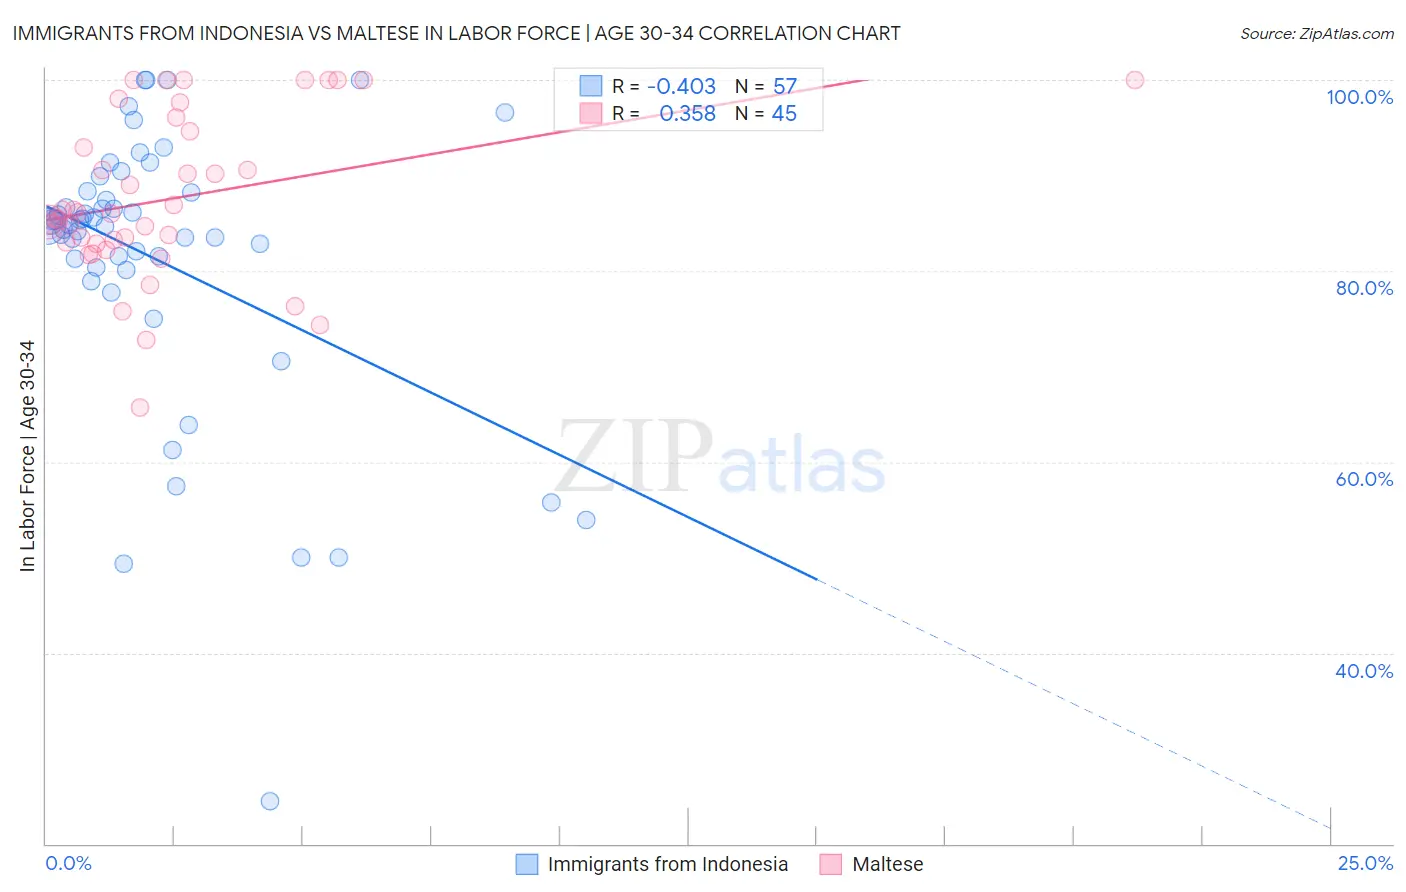
Immigrants from Indonesia vs Maltese In Labor Force | Age 30-34 Correlation Chart
The statistical analysis conducted on geographies consisting of 215,722,421 people shows a moderate negative correlation between the proportion of Immigrants from Indonesia and labor force participation rate among population between the ages 30 and 34 in the United States with a correlation coefficient (R) of -0.403 and weighted average of 84.9%. Similarly, the statistical analysis conducted on geographies consisting of 126,441,405 people shows a mild positive correlation between the proportion of Maltese and labor force participation rate among population between the ages 30 and 34 in the United States with a correlation coefficient (R) of 0.358 and weighted average of 85.4%, a difference of 0.51%.
In Labor Force | Age 30-34 Correlation Summary
| Measurement | Immigrants from Indonesia | Maltese |
| Minimum | 24.5% | 65.7% |
| Maximum | 100.0% | 100.0% |
| Range | 75.5% | 34.3% |
| Mean | 81.2% | 87.6% |
| Median | 84.8% | 85.9% |
| Interquartile 25% (IQ1) | 80.3% | 83.0% |
| Interquartile 75% (IQ3) | 88.3% | 95.4% |
| Interquartile Range (IQR) | 8.0% | 12.4% |
| Standard Deviation (Sample) | 14.8% | 8.5% |
| Standard Deviation (Population) | 14.7% | 8.4% |
Similar Demographics by In Labor Force | Age 30-34
Demographics Similar to Immigrants from Indonesia by In Labor Force | Age 30-34
In terms of in labor force | age 30-34, the demographic groups most similar to Immigrants from Indonesia are Chilean (84.9%, a difference of 0.010%), Immigrants from Vietnam (85.0%, a difference of 0.030%), Colombian (84.9%, a difference of 0.030%), South African (85.0%, a difference of 0.050%), and Sri Lankan (85.0%, a difference of 0.050%).
| Demographics | Rating | Rank | In Labor Force | Age 30-34 |
| Immigrants | Asia | 88.9 /100 | #135 | Excellent 85.0% |
| Jordanians | 88.6 /100 | #136 | Excellent 85.0% |
| South Africans | 88.0 /100 | #137 | Excellent 85.0% |
| Sri Lankans | 87.8 /100 | #138 | Excellent 85.0% |
| Bhutanese | 87.5 /100 | #139 | Excellent 85.0% |
| Immigrants | Vietnam | 86.5 /100 | #140 | Excellent 85.0% |
| Chileans | 85.3 /100 | #141 | Excellent 84.9% |
| Immigrants | Indonesia | 84.3 /100 | #142 | Excellent 84.9% |
| Colombians | 82.2 /100 | #143 | Excellent 84.9% |
| Uruguayans | 78.5 /100 | #144 | Good 84.9% |
| Palestinians | 77.7 /100 | #145 | Good 84.9% |
| Immigrants | Saudi Arabia | 76.6 /100 | #146 | Good 84.9% |
| Immigrants | Colombia | 76.3 /100 | #147 | Good 84.9% |
| Immigrants | Pakistan | 76.2 /100 | #148 | Good 84.9% |
| Immigrants | Ukraine | 75.1 /100 | #149 | Good 84.8% |
Demographics Similar to Maltese by In Labor Force | Age 30-34
In terms of in labor force | age 30-34, the demographic groups most similar to Maltese are Immigrants from China (85.4%, a difference of 0.0%), Indian (Asian) (85.4%, a difference of 0.0%), Brazilian (85.4%, a difference of 0.010%), Immigrants from Japan (85.4%, a difference of 0.010%), and Immigrants from Czechoslovakia (85.4%, a difference of 0.010%).
| Demographics | Rating | Rank | In Labor Force | Age 30-34 |
| Kenyans | 99.3 /100 | #67 | Exceptional 85.4% |
| Immigrants | Eastern Europe | 99.3 /100 | #68 | Exceptional 85.4% |
| Immigrants | Iran | 99.2 /100 | #69 | Exceptional 85.4% |
| Brazilians | 99.1 /100 | #70 | Exceptional 85.4% |
| Immigrants | Japan | 99.1 /100 | #71 | Exceptional 85.4% |
| Immigrants | China | 99.0 /100 | #72 | Exceptional 85.4% |
| Indians (Asian) | 99.0 /100 | #73 | Exceptional 85.4% |
| Maltese | 99.0 /100 | #74 | Exceptional 85.4% |
| Immigrants | Czechoslovakia | 99.0 /100 | #75 | Exceptional 85.4% |
| Iranians | 99.0 /100 | #76 | Exceptional 85.4% |
| Immigrants | Eastern Asia | 98.9 /100 | #77 | Exceptional 85.4% |
| Immigrants | Singapore | 98.8 /100 | #78 | Exceptional 85.3% |
| Immigrants | Switzerland | 98.7 /100 | #79 | Exceptional 85.3% |
| Immigrants | Russia | 98.7 /100 | #80 | Exceptional 85.3% |
| Slovaks | 98.7 /100 | #81 | Exceptional 85.3% |