Ukrainian vs Immigrants from South America In Labor Force | Age 30-34
COMPARE
Ukrainian
Immigrants from South America
In Labor Force | Age 30-34
In Labor Force | Age 30-34 Comparison
Ukrainians
Immigrants from South America
85.2%
IN LABOR FORCE | AGE 30-34
96.6/ 100
METRIC RATING
103rd/ 347
METRIC RANK
84.7%
IN LABOR FORCE | AGE 30-34
50.0/ 100
METRIC RATING
175th/ 347
METRIC RANK
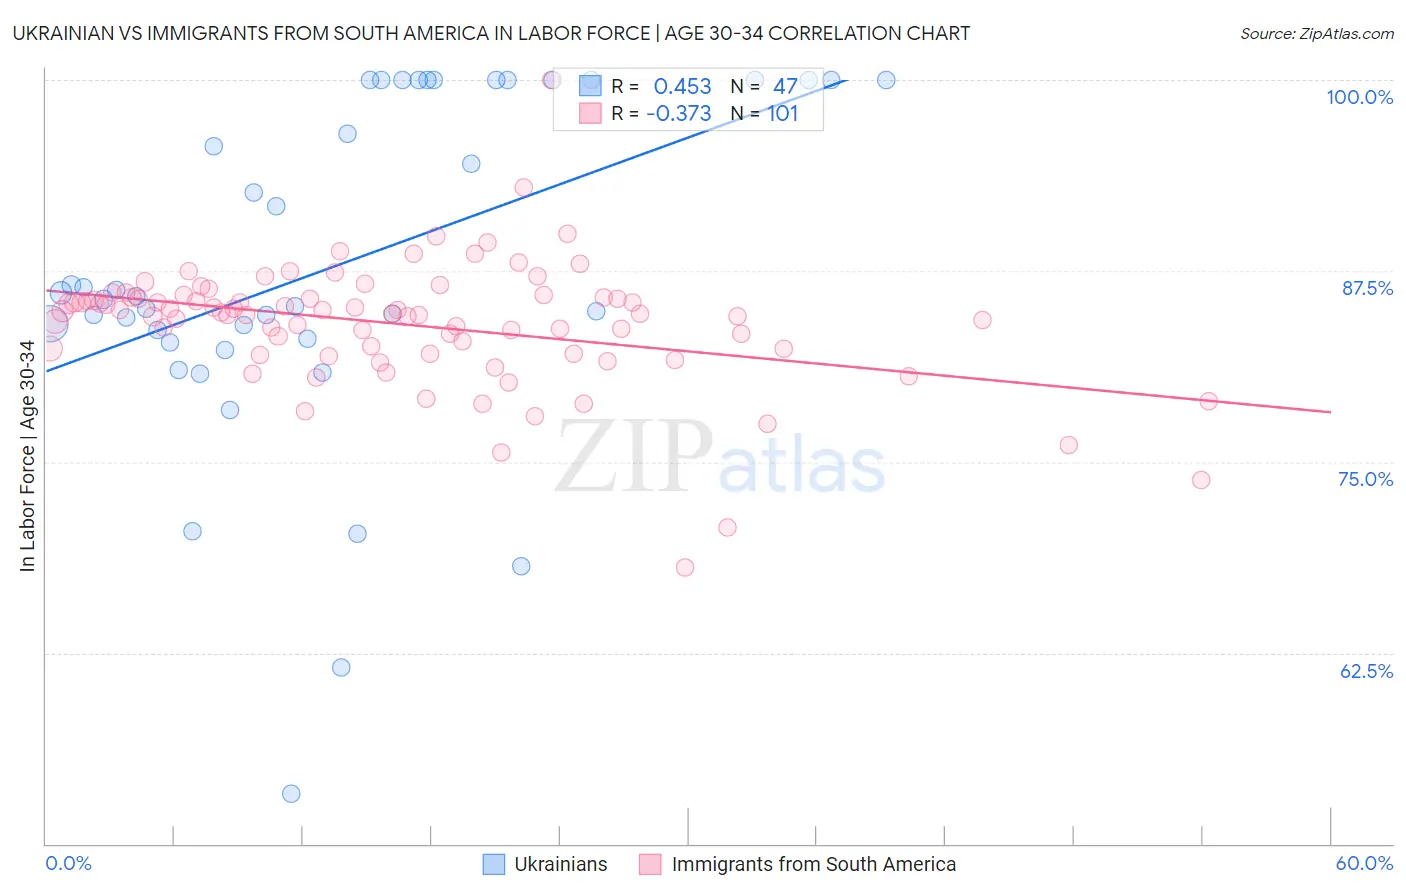
Ukrainian vs Immigrants from South America In Labor Force | Age 30-34 Correlation Chart
The statistical analysis conducted on geographies consisting of 448,215,384 people shows a moderate positive correlation between the proportion of Ukrainians and labor force participation rate among population between the ages 30 and 34 in the United States with a correlation coefficient (R) of 0.453 and weighted average of 85.2%. Similarly, the statistical analysis conducted on geographies consisting of 485,985,237 people shows a mild negative correlation between the proportion of Immigrants from South America and labor force participation rate among population between the ages 30 and 34 in the United States with a correlation coefficient (R) of -0.373 and weighted average of 84.7%, a difference of 0.59%.
In Labor Force | Age 30-34 Correlation Summary
| Measurement | Ukrainian | Immigrants from South America |
| Minimum | 53.3% | 68.1% |
| Maximum | 100.0% | 100.0% |
| Range | 46.7% | 31.9% |
| Mean | 87.8% | 84.0% |
| Median | 85.8% | 84.7% |
| Interquartile 25% (IQ1) | 83.0% | 82.3% |
| Interquartile 75% (IQ3) | 100.0% | 85.8% |
| Interquartile Range (IQR) | 17.0% | 3.5% |
| Standard Deviation (Sample) | 11.1% | 4.1% |
| Standard Deviation (Population) | 10.9% | 4.1% |
Similar Demographics by In Labor Force | Age 30-34
Demographics Similar to Ukrainians by In Labor Force | Age 30-34
In terms of in labor force | age 30-34, the demographic groups most similar to Ukrainians are Immigrants from Ghana (85.2%, a difference of 0.0%), Immigrants from Austria (85.2%, a difference of 0.010%), Alsatian (85.2%, a difference of 0.010%), Immigrants from Middle Africa (85.2%, a difference of 0.010%), and Immigrants from Northern Africa (85.2%, a difference of 0.010%).
| Demographics | Rating | Rank | In Labor Force | Age 30-34 |
| Immigrants | Korea | 97.3 /100 | #96 | Exceptional 85.2% |
| Thais | 97.2 /100 | #97 | Exceptional 85.2% |
| Immigrants | Uganda | 97.2 /100 | #98 | Exceptional 85.2% |
| Belgians | 97.2 /100 | #99 | Exceptional 85.2% |
| Sudanese | 97.1 /100 | #100 | Exceptional 85.2% |
| Immigrants | Belarus | 96.9 /100 | #101 | Exceptional 85.2% |
| Immigrants | Austria | 96.8 /100 | #102 | Exceptional 85.2% |
| Ukrainians | 96.6 /100 | #103 | Exceptional 85.2% |
| Immigrants | Ghana | 96.5 /100 | #104 | Exceptional 85.2% |
| Alsatians | 96.3 /100 | #105 | Exceptional 85.2% |
| Immigrants | Middle Africa | 96.3 /100 | #106 | Exceptional 85.2% |
| Immigrants | Northern Africa | 96.3 /100 | #107 | Exceptional 85.2% |
| Immigrants | Zimbabwe | 95.8 /100 | #108 | Exceptional 85.1% |
| Argentineans | 95.8 /100 | #109 | Exceptional 85.1% |
| Immigrants | South Africa | 95.3 /100 | #110 | Exceptional 85.1% |
Demographics Similar to Immigrants from South America by In Labor Force | Age 30-34
In terms of in labor force | age 30-34, the demographic groups most similar to Immigrants from South America are Finnish (84.7%, a difference of 0.0%), Immigrants from Burma/Myanmar (84.7%, a difference of 0.010%), Irish (84.7%, a difference of 0.010%), Immigrants from England (84.7%, a difference of 0.010%), and Israeli (84.7%, a difference of 0.010%).
| Demographics | Rating | Rank | In Labor Force | Age 30-34 |
| Immigrants | Peru | 52.4 /100 | #168 | Average 84.7% |
| South American Indians | 52.1 /100 | #169 | Average 84.7% |
| Immigrants | Burma/Myanmar | 52.0 /100 | #170 | Average 84.7% |
| Irish | 52.0 /100 | #171 | Average 84.7% |
| Immigrants | England | 51.7 /100 | #172 | Average 84.7% |
| Israelis | 51.1 /100 | #173 | Average 84.7% |
| Finns | 50.0 /100 | #174 | Average 84.7% |
| Immigrants | South America | 50.0 /100 | #175 | Average 84.7% |
| Immigrants | Uzbekistan | 49.1 /100 | #176 | Average 84.7% |
| Laotians | 46.9 /100 | #177 | Average 84.7% |
| Okinawans | 44.1 /100 | #178 | Average 84.6% |
| Immigrants | Nigeria | 42.5 /100 | #179 | Average 84.6% |
| Immigrants | Netherlands | 42.1 /100 | #180 | Average 84.6% |
| Moroccans | 40.3 /100 | #181 | Average 84.6% |
| Barbadians | 36.7 /100 | #182 | Fair 84.6% |