Maltese vs Immigrants from South America In Labor Force | Age 30-34
COMPARE
Maltese
Immigrants from South America
In Labor Force | Age 30-34
In Labor Force | Age 30-34 Comparison
Maltese
Immigrants from South America
85.4%
IN LABOR FORCE | AGE 30-34
99.0/ 100
METRIC RATING
74th/ 347
METRIC RANK
84.7%
IN LABOR FORCE | AGE 30-34
50.0/ 100
METRIC RATING
175th/ 347
METRIC RANK
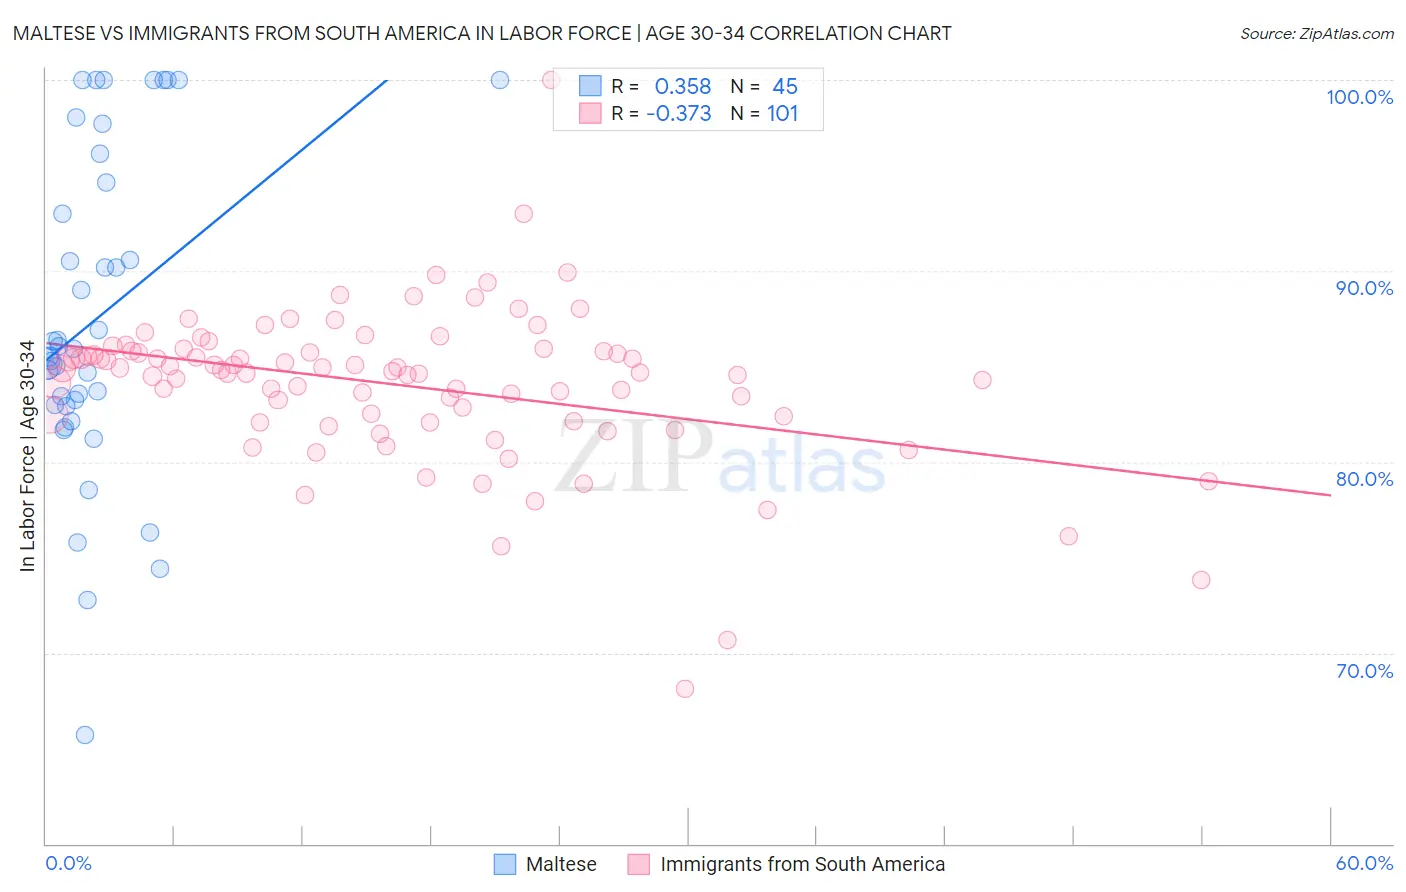
Maltese vs Immigrants from South America In Labor Force | Age 30-34 Correlation Chart
The statistical analysis conducted on geographies consisting of 126,441,405 people shows a mild positive correlation between the proportion of Maltese and labor force participation rate among population between the ages 30 and 34 in the United States with a correlation coefficient (R) of 0.358 and weighted average of 85.4%. Similarly, the statistical analysis conducted on geographies consisting of 485,985,237 people shows a mild negative correlation between the proportion of Immigrants from South America and labor force participation rate among population between the ages 30 and 34 in the United States with a correlation coefficient (R) of -0.373 and weighted average of 84.7%, a difference of 0.81%.
In Labor Force | Age 30-34 Correlation Summary
| Measurement | Maltese | Immigrants from South America |
| Minimum | 65.7% | 68.1% |
| Maximum | 100.0% | 100.0% |
| Range | 34.3% | 31.9% |
| Mean | 87.6% | 84.0% |
| Median | 85.9% | 84.7% |
| Interquartile 25% (IQ1) | 83.0% | 82.3% |
| Interquartile 75% (IQ3) | 95.4% | 85.8% |
| Interquartile Range (IQR) | 12.4% | 3.5% |
| Standard Deviation (Sample) | 8.5% | 4.1% |
| Standard Deviation (Population) | 8.4% | 4.1% |
Similar Demographics by In Labor Force | Age 30-34
Demographics Similar to Maltese by In Labor Force | Age 30-34
In terms of in labor force | age 30-34, the demographic groups most similar to Maltese are Immigrants from China (85.4%, a difference of 0.0%), Indian (Asian) (85.4%, a difference of 0.0%), Brazilian (85.4%, a difference of 0.010%), Immigrants from Japan (85.4%, a difference of 0.010%), and Immigrants from Czechoslovakia (85.4%, a difference of 0.010%).
| Demographics | Rating | Rank | In Labor Force | Age 30-34 |
| Kenyans | 99.3 /100 | #67 | Exceptional 85.4% |
| Immigrants | Eastern Europe | 99.3 /100 | #68 | Exceptional 85.4% |
| Immigrants | Iran | 99.2 /100 | #69 | Exceptional 85.4% |
| Brazilians | 99.1 /100 | #70 | Exceptional 85.4% |
| Immigrants | Japan | 99.1 /100 | #71 | Exceptional 85.4% |
| Immigrants | China | 99.0 /100 | #72 | Exceptional 85.4% |
| Indians (Asian) | 99.0 /100 | #73 | Exceptional 85.4% |
| Maltese | 99.0 /100 | #74 | Exceptional 85.4% |
| Immigrants | Czechoslovakia | 99.0 /100 | #75 | Exceptional 85.4% |
| Iranians | 99.0 /100 | #76 | Exceptional 85.4% |
| Immigrants | Eastern Asia | 98.9 /100 | #77 | Exceptional 85.4% |
| Immigrants | Singapore | 98.8 /100 | #78 | Exceptional 85.3% |
| Immigrants | Switzerland | 98.7 /100 | #79 | Exceptional 85.3% |
| Immigrants | Russia | 98.7 /100 | #80 | Exceptional 85.3% |
| Slovaks | 98.7 /100 | #81 | Exceptional 85.3% |
Demographics Similar to Immigrants from South America by In Labor Force | Age 30-34
In terms of in labor force | age 30-34, the demographic groups most similar to Immigrants from South America are Finnish (84.7%, a difference of 0.0%), Immigrants from Burma/Myanmar (84.7%, a difference of 0.010%), Irish (84.7%, a difference of 0.010%), Immigrants from England (84.7%, a difference of 0.010%), and Israeli (84.7%, a difference of 0.010%).
| Demographics | Rating | Rank | In Labor Force | Age 30-34 |
| Immigrants | Peru | 52.4 /100 | #168 | Average 84.7% |
| South American Indians | 52.1 /100 | #169 | Average 84.7% |
| Immigrants | Burma/Myanmar | 52.0 /100 | #170 | Average 84.7% |
| Irish | 52.0 /100 | #171 | Average 84.7% |
| Immigrants | England | 51.7 /100 | #172 | Average 84.7% |
| Israelis | 51.1 /100 | #173 | Average 84.7% |
| Finns | 50.0 /100 | #174 | Average 84.7% |
| Immigrants | South America | 50.0 /100 | #175 | Average 84.7% |
| Immigrants | Uzbekistan | 49.1 /100 | #176 | Average 84.7% |
| Laotians | 46.9 /100 | #177 | Average 84.7% |
| Okinawans | 44.1 /100 | #178 | Average 84.6% |
| Immigrants | Nigeria | 42.5 /100 | #179 | Average 84.6% |
| Immigrants | Netherlands | 42.1 /100 | #180 | Average 84.6% |
| Moroccans | 40.3 /100 | #181 | Average 84.6% |
| Barbadians | 36.7 /100 | #182 | Fair 84.6% |