Guamanian/Chamorro vs Immigrants from South America In Labor Force | Age 30-34
COMPARE
Guamanian/Chamorro
Immigrants from South America
In Labor Force | Age 30-34
In Labor Force | Age 30-34 Comparison
Guamanians/Chamorros
Immigrants from South America
83.5%
IN LABOR FORCE | AGE 30-34
0.0/ 100
METRIC RATING
273rd/ 347
METRIC RANK
84.7%
IN LABOR FORCE | AGE 30-34
50.0/ 100
METRIC RATING
175th/ 347
METRIC RANK
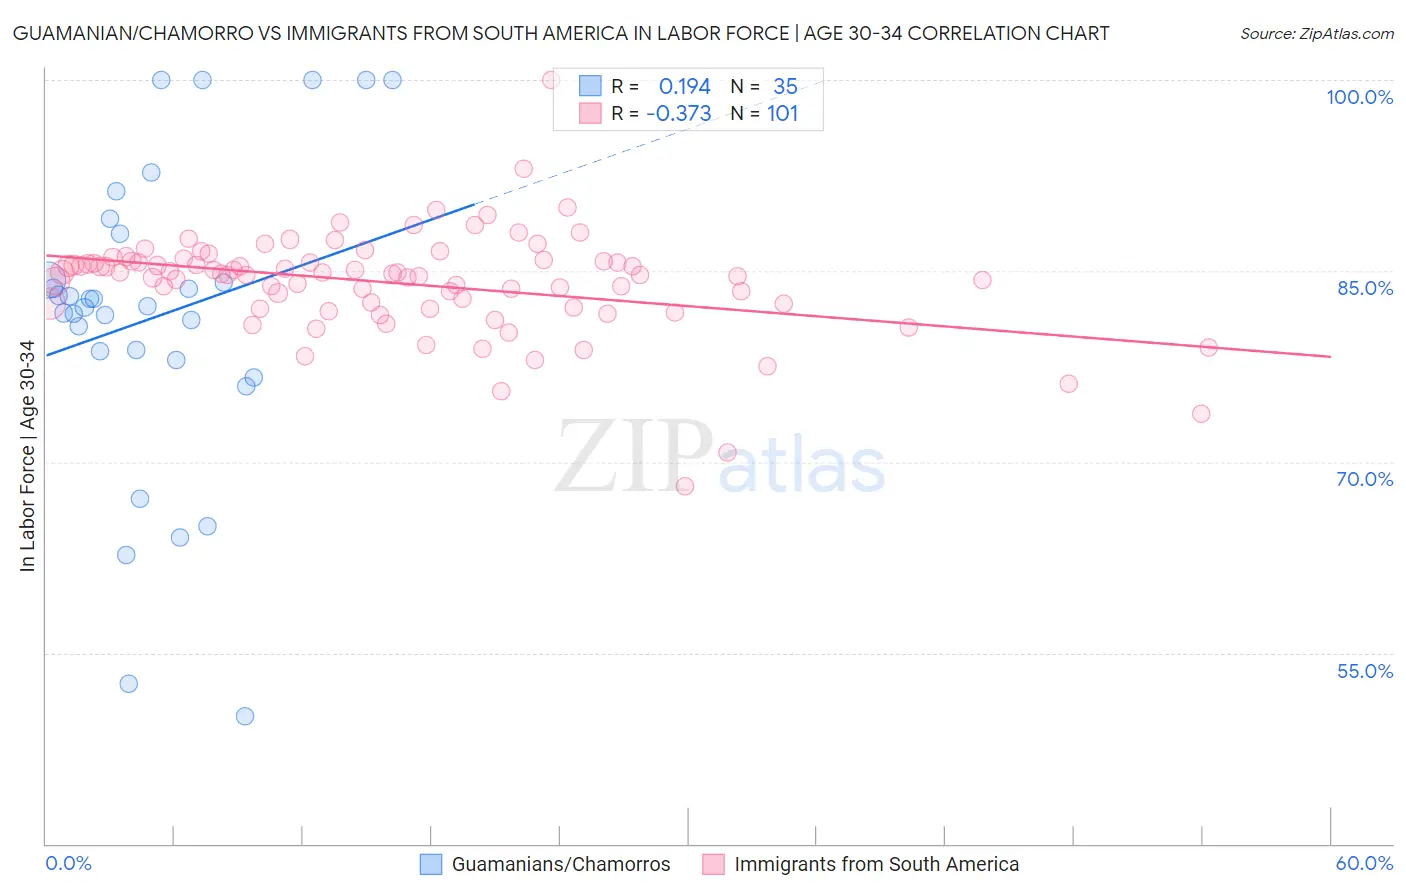
Guamanian/Chamorro vs Immigrants from South America In Labor Force | Age 30-34 Correlation Chart
The statistical analysis conducted on geographies consisting of 221,913,161 people shows a poor positive correlation between the proportion of Guamanians/Chamorros and labor force participation rate among population between the ages 30 and 34 in the United States with a correlation coefficient (R) of 0.194 and weighted average of 83.5%. Similarly, the statistical analysis conducted on geographies consisting of 485,985,237 people shows a mild negative correlation between the proportion of Immigrants from South America and labor force participation rate among population between the ages 30 and 34 in the United States with a correlation coefficient (R) of -0.373 and weighted average of 84.7%, a difference of 1.4%.
In Labor Force | Age 30-34 Correlation Summary
| Measurement | Guamanian/Chamorro | Immigrants from South America |
| Minimum | 50.0% | 68.1% |
| Maximum | 100.0% | 100.0% |
| Range | 50.0% | 31.9% |
| Mean | 81.4% | 84.0% |
| Median | 82.3% | 84.7% |
| Interquartile 25% (IQ1) | 78.0% | 82.3% |
| Interquartile 75% (IQ3) | 87.9% | 85.8% |
| Interquartile Range (IQR) | 9.9% | 3.5% |
| Standard Deviation (Sample) | 12.3% | 4.1% |
| Standard Deviation (Population) | 12.1% | 4.1% |
Similar Demographics by In Labor Force | Age 30-34
Demographics Similar to Guamanians/Chamorros by In Labor Force | Age 30-34
In terms of in labor force | age 30-34, the demographic groups most similar to Guamanians/Chamorros are Belizean (83.5%, a difference of 0.010%), Immigrants from Grenada (83.5%, a difference of 0.020%), Tongan (83.5%, a difference of 0.020%), Delaware (83.5%, a difference of 0.040%), and Spanish (83.5%, a difference of 0.050%).
| Demographics | Rating | Rank | In Labor Force | Age 30-34 |
| Immigrants | Guatemala | 0.1 /100 | #266 | Tragic 83.7% |
| Spaniards | 0.1 /100 | #267 | Tragic 83.6% |
| Immigrants | Bangladesh | 0.1 /100 | #268 | Tragic 83.6% |
| Vietnamese | 0.1 /100 | #269 | Tragic 83.6% |
| Spanish Americans | 0.0 /100 | #270 | Tragic 83.5% |
| Spanish | 0.0 /100 | #271 | Tragic 83.5% |
| Immigrants | Nonimmigrants | 0.0 /100 | #272 | Tragic 83.5% |
| Guamanians/Chamorros | 0.0 /100 | #273 | Tragic 83.5% |
| Belizeans | 0.0 /100 | #274 | Tragic 83.5% |
| Immigrants | Grenada | 0.0 /100 | #275 | Tragic 83.5% |
| Tongans | 0.0 /100 | #276 | Tragic 83.5% |
| Delaware | 0.0 /100 | #277 | Tragic 83.5% |
| Fijians | 0.0 /100 | #278 | Tragic 83.4% |
| Immigrants | Fiji | 0.0 /100 | #279 | Tragic 83.4% |
| Africans | 0.0 /100 | #280 | Tragic 83.4% |
Demographics Similar to Immigrants from South America by In Labor Force | Age 30-34
In terms of in labor force | age 30-34, the demographic groups most similar to Immigrants from South America are Finnish (84.7%, a difference of 0.0%), Immigrants from Burma/Myanmar (84.7%, a difference of 0.010%), Irish (84.7%, a difference of 0.010%), Immigrants from England (84.7%, a difference of 0.010%), and Israeli (84.7%, a difference of 0.010%).
| Demographics | Rating | Rank | In Labor Force | Age 30-34 |
| Immigrants | Peru | 52.4 /100 | #168 | Average 84.7% |
| South American Indians | 52.1 /100 | #169 | Average 84.7% |
| Immigrants | Burma/Myanmar | 52.0 /100 | #170 | Average 84.7% |
| Irish | 52.0 /100 | #171 | Average 84.7% |
| Immigrants | England | 51.7 /100 | #172 | Average 84.7% |
| Israelis | 51.1 /100 | #173 | Average 84.7% |
| Finns | 50.0 /100 | #174 | Average 84.7% |
| Immigrants | South America | 50.0 /100 | #175 | Average 84.7% |
| Immigrants | Uzbekistan | 49.1 /100 | #176 | Average 84.7% |
| Laotians | 46.9 /100 | #177 | Average 84.7% |
| Okinawans | 44.1 /100 | #178 | Average 84.6% |
| Immigrants | Nigeria | 42.5 /100 | #179 | Average 84.6% |
| Immigrants | Netherlands | 42.1 /100 | #180 | Average 84.6% |
| Moroccans | 40.3 /100 | #181 | Average 84.6% |
| Barbadians | 36.7 /100 | #182 | Fair 84.6% |