Immigrants from Dominica vs Immigrants from South America In Labor Force | Age 30-34
COMPARE
Immigrants from Dominica
Immigrants from South America
In Labor Force | Age 30-34
In Labor Force | Age 30-34 Comparison
Immigrants from Dominica
Immigrants from South America
84.0%
IN LABOR FORCE | AGE 30-34
0.7/ 100
METRIC RATING
249th/ 347
METRIC RANK
84.7%
IN LABOR FORCE | AGE 30-34
50.0/ 100
METRIC RATING
175th/ 347
METRIC RANK
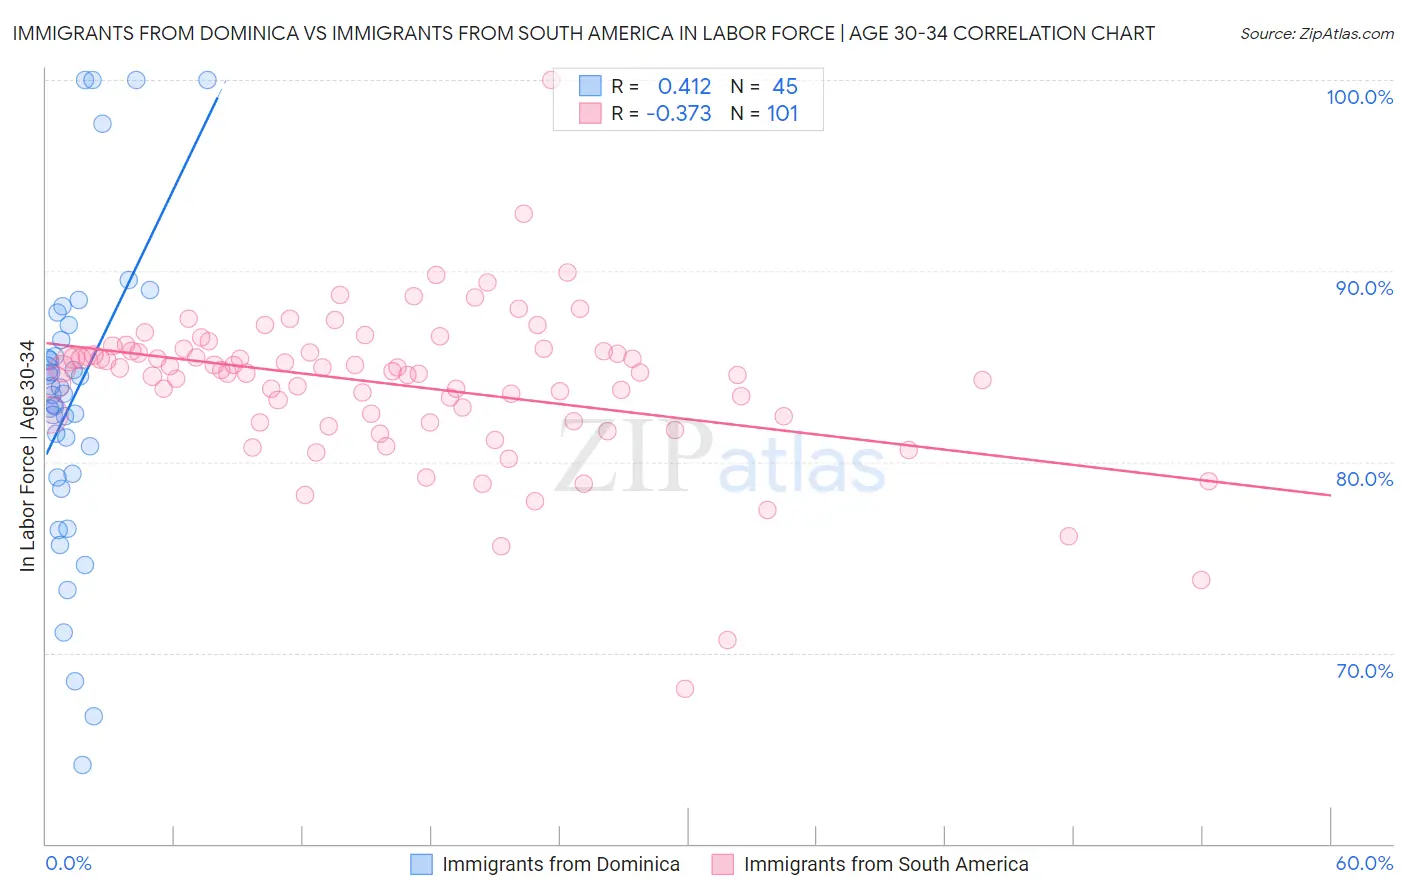
Immigrants from Dominica vs Immigrants from South America In Labor Force | Age 30-34 Correlation Chart
The statistical analysis conducted on geographies consisting of 83,795,636 people shows a moderate positive correlation between the proportion of Immigrants from Dominica and labor force participation rate among population between the ages 30 and 34 in the United States with a correlation coefficient (R) of 0.412 and weighted average of 84.0%. Similarly, the statistical analysis conducted on geographies consisting of 485,985,237 people shows a mild negative correlation between the proportion of Immigrants from South America and labor force participation rate among population between the ages 30 and 34 in the United States with a correlation coefficient (R) of -0.373 and weighted average of 84.7%, a difference of 0.87%.
In Labor Force | Age 30-34 Correlation Summary
| Measurement | Immigrants from Dominica | Immigrants from South America |
| Minimum | 64.1% | 68.1% |
| Maximum | 100.0% | 100.0% |
| Range | 35.9% | 31.9% |
| Mean | 83.4% | 84.0% |
| Median | 83.6% | 84.7% |
| Interquartile 25% (IQ1) | 79.3% | 82.3% |
| Interquartile 75% (IQ3) | 86.8% | 85.8% |
| Interquartile Range (IQR) | 7.5% | 3.5% |
| Standard Deviation (Sample) | 8.2% | 4.1% |
| Standard Deviation (Population) | 8.1% | 4.1% |
Similar Demographics by In Labor Force | Age 30-34
Demographics Similar to Immigrants from Dominica by In Labor Force | Age 30-34
In terms of in labor force | age 30-34, the demographic groups most similar to Immigrants from Dominica are Portuguese (84.0%, a difference of 0.0%), British West Indian (84.0%, a difference of 0.020%), Immigrants from Iraq (83.9%, a difference of 0.020%), Basque (84.0%, a difference of 0.040%), and Immigrants from Venezuela (84.0%, a difference of 0.040%).
| Demographics | Rating | Rank | In Labor Force | Age 30-34 |
| Immigrants | Oceania | 1.1 /100 | #242 | Tragic 84.0% |
| Immigrants | Caribbean | 1.1 /100 | #243 | Tragic 84.0% |
| Basques | 0.9 /100 | #244 | Tragic 84.0% |
| Immigrants | Venezuela | 0.9 /100 | #245 | Tragic 84.0% |
| Central Americans | 0.9 /100 | #246 | Tragic 84.0% |
| British West Indians | 0.8 /100 | #247 | Tragic 84.0% |
| Portuguese | 0.8 /100 | #248 | Tragic 84.0% |
| Immigrants | Dominica | 0.7 /100 | #249 | Tragic 84.0% |
| Immigrants | Iraq | 0.7 /100 | #250 | Tragic 83.9% |
| Nicaraguans | 0.6 /100 | #251 | Tragic 83.9% |
| Bahamians | 0.6 /100 | #252 | Tragic 83.9% |
| Immigrants | Nicaragua | 0.6 /100 | #253 | Tragic 83.9% |
| Immigrants | St. Vincent and the Grenadines | 0.5 /100 | #254 | Tragic 83.9% |
| Whites/Caucasians | 0.5 /100 | #255 | Tragic 83.9% |
| Immigrants | Lebanon | 0.4 /100 | #256 | Tragic 83.9% |
Demographics Similar to Immigrants from South America by In Labor Force | Age 30-34
In terms of in labor force | age 30-34, the demographic groups most similar to Immigrants from South America are Finnish (84.7%, a difference of 0.0%), Immigrants from Burma/Myanmar (84.7%, a difference of 0.010%), Irish (84.7%, a difference of 0.010%), Immigrants from England (84.7%, a difference of 0.010%), and Israeli (84.7%, a difference of 0.010%).
| Demographics | Rating | Rank | In Labor Force | Age 30-34 |
| Immigrants | Peru | 52.4 /100 | #168 | Average 84.7% |
| South American Indians | 52.1 /100 | #169 | Average 84.7% |
| Immigrants | Burma/Myanmar | 52.0 /100 | #170 | Average 84.7% |
| Irish | 52.0 /100 | #171 | Average 84.7% |
| Immigrants | England | 51.7 /100 | #172 | Average 84.7% |
| Israelis | 51.1 /100 | #173 | Average 84.7% |
| Finns | 50.0 /100 | #174 | Average 84.7% |
| Immigrants | South America | 50.0 /100 | #175 | Average 84.7% |
| Immigrants | Uzbekistan | 49.1 /100 | #176 | Average 84.7% |
| Laotians | 46.9 /100 | #177 | Average 84.7% |
| Okinawans | 44.1 /100 | #178 | Average 84.6% |
| Immigrants | Nigeria | 42.5 /100 | #179 | Average 84.6% |
| Immigrants | Netherlands | 42.1 /100 | #180 | Average 84.6% |
| Moroccans | 40.3 /100 | #181 | Average 84.6% |
| Barbadians | 36.7 /100 | #182 | Fair 84.6% |