Icelander vs Immigrants from Australia In Labor Force | Age 25-29
COMPARE
Icelander
Immigrants from Australia
In Labor Force | Age 25-29
In Labor Force | Age 25-29 Comparison
Icelanders
Immigrants from Australia
84.8%
IN LABOR FORCE | AGE 25-29
68.2/ 100
METRIC RATING
146th/ 347
METRIC RANK
85.3%
IN LABOR FORCE | AGE 25-29
98.9/ 100
METRIC RATING
72nd/ 347
METRIC RANK
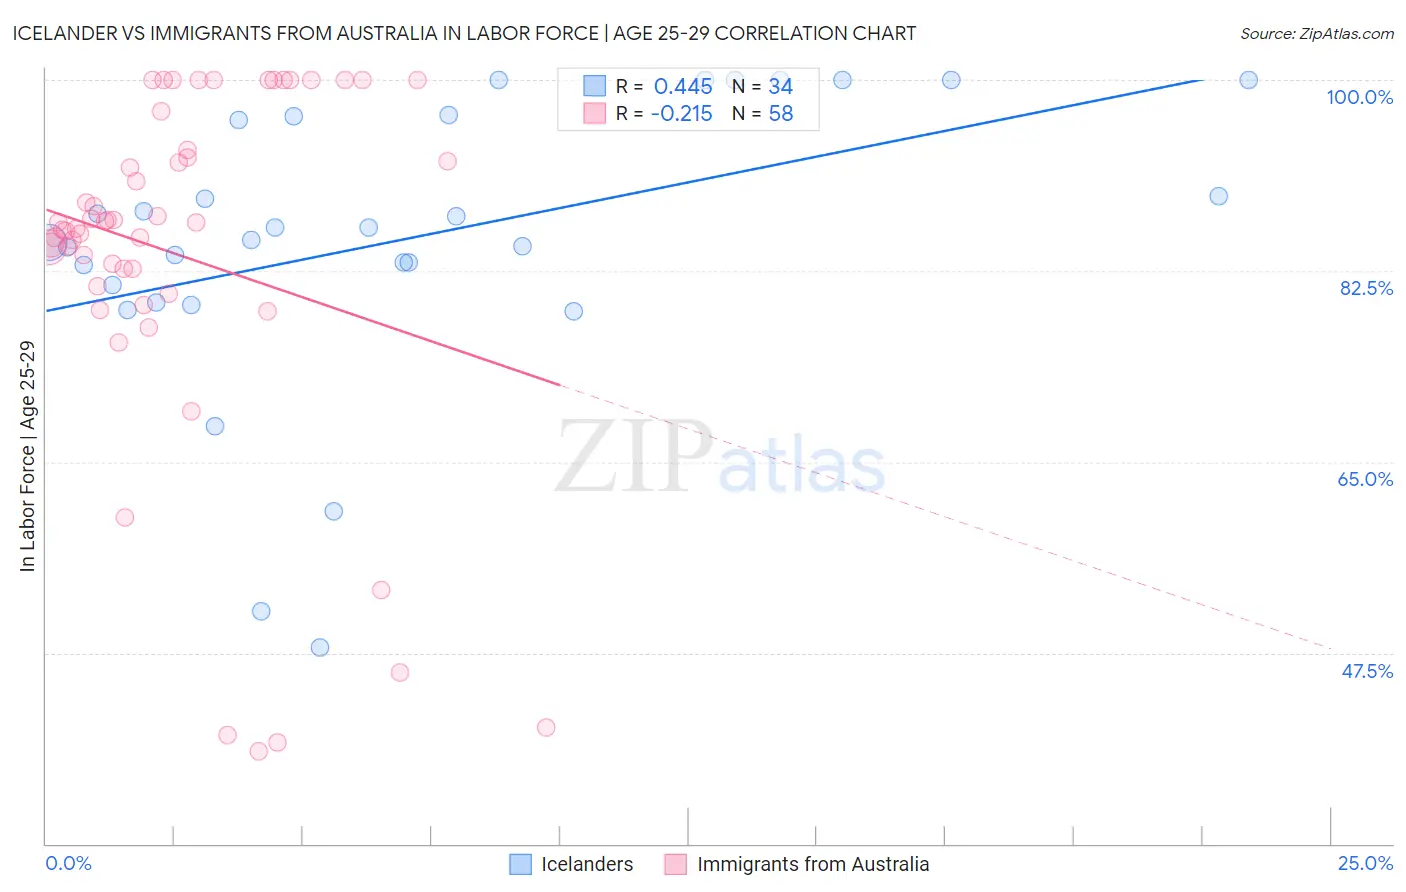
Icelander vs Immigrants from Australia In Labor Force | Age 25-29 Correlation Chart
The statistical analysis conducted on geographies consisting of 159,638,319 people shows a moderate positive correlation between the proportion of Icelanders and labor force participation rate among population between the ages 25 and 29 in the United States with a correlation coefficient (R) of 0.445 and weighted average of 84.8%. Similarly, the statistical analysis conducted on geographies consisting of 227,173,670 people shows a weak negative correlation between the proportion of Immigrants from Australia and labor force participation rate among population between the ages 25 and 29 in the United States with a correlation coefficient (R) of -0.215 and weighted average of 85.3%, a difference of 0.68%.
In Labor Force | Age 25-29 Correlation Summary
| Measurement | Icelander | Immigrants from Australia |
| Minimum | 48.0% | 38.5% |
| Maximum | 100.0% | 100.0% |
| Range | 52.0% | 61.5% |
| Mean | 85.4% | 83.9% |
| Median | 85.9% | 86.6% |
| Interquartile 25% (IQ1) | 81.2% | 81.1% |
| Interquartile 75% (IQ3) | 96.7% | 93.5% |
| Interquartile Range (IQR) | 15.5% | 12.5% |
| Standard Deviation (Sample) | 13.0% | 16.4% |
| Standard Deviation (Population) | 12.8% | 16.3% |
Similar Demographics by In Labor Force | Age 25-29
Demographics Similar to Icelanders by In Labor Force | Age 25-29
In terms of in labor force | age 25-29, the demographic groups most similar to Icelanders are Immigrants from Senegal (84.8%, a difference of 0.0%), Immigrants from Asia (84.8%, a difference of 0.0%), Sri Lankan (84.8%, a difference of 0.010%), Immigrants from Laos (84.8%, a difference of 0.010%), and Pakistani (84.8%, a difference of 0.020%).
| Demographics | Rating | Rank | In Labor Force | Age 25-29 |
| Immigrants | Eastern Asia | 72.6 /100 | #139 | Good 84.8% |
| Immigrants | North America | 72.1 /100 | #140 | Good 84.8% |
| Danes | 71.9 /100 | #141 | Good 84.8% |
| Pakistanis | 70.0 /100 | #142 | Good 84.8% |
| Sri Lankans | 69.2 /100 | #143 | Good 84.8% |
| Immigrants | Laos | 69.0 /100 | #144 | Good 84.8% |
| Immigrants | Senegal | 68.3 /100 | #145 | Good 84.8% |
| Icelanders | 68.2 /100 | #146 | Good 84.8% |
| Immigrants | Asia | 68.2 /100 | #147 | Good 84.8% |
| Immigrants | England | 65.2 /100 | #148 | Good 84.7% |
| Peruvians | 64.7 /100 | #149 | Good 84.7% |
| Swiss | 64.7 /100 | #150 | Good 84.7% |
| Colombians | 62.8 /100 | #151 | Good 84.7% |
| Immigrants | Pakistan | 62.7 /100 | #152 | Good 84.7% |
| Immigrants | Taiwan | 62.2 /100 | #153 | Good 84.7% |
Demographics Similar to Immigrants from Australia by In Labor Force | Age 25-29
In terms of in labor force | age 25-29, the demographic groups most similar to Immigrants from Australia are Russian (85.3%, a difference of 0.010%), Kenyan (85.4%, a difference of 0.020%), Menominee (85.4%, a difference of 0.040%), Immigrants from Sweden (85.4%, a difference of 0.040%), and Soviet Union (85.3%, a difference of 0.050%).
| Demographics | Rating | Rank | In Labor Force | Age 25-29 |
| Immigrants | Czechoslovakia | 99.3 /100 | #65 | Exceptional 85.4% |
| Immigrants | Scotland | 99.3 /100 | #66 | Exceptional 85.4% |
| Immigrants | Turkey | 99.2 /100 | #67 | Exceptional 85.4% |
| Immigrants | Cameroon | 99.2 /100 | #68 | Exceptional 85.4% |
| Menominee | 99.1 /100 | #69 | Exceptional 85.4% |
| Immigrants | Sweden | 99.1 /100 | #70 | Exceptional 85.4% |
| Kenyans | 99.0 /100 | #71 | Exceptional 85.4% |
| Immigrants | Australia | 98.9 /100 | #72 | Exceptional 85.3% |
| Russians | 98.8 /100 | #73 | Exceptional 85.3% |
| Soviet Union | 98.5 /100 | #74 | Exceptional 85.3% |
| Brazilians | 98.3 /100 | #75 | Exceptional 85.3% |
| Germans | 98.1 /100 | #76 | Exceptional 85.3% |
| Immigrants | South Central Asia | 97.9 /100 | #77 | Exceptional 85.2% |
| Immigrants | Egypt | 97.7 /100 | #78 | Exceptional 85.2% |
| Immigrants | Northern Africa | 97.6 /100 | #79 | Exceptional 85.2% |