Icelander vs Zimbabwean In Labor Force | Age 25-29
COMPARE
Icelander
Zimbabwean
In Labor Force | Age 25-29
In Labor Force | Age 25-29 Comparison
Icelanders
Zimbabweans
84.8%
IN LABOR FORCE | AGE 25-29
68.2/ 100
METRIC RATING
146th/ 347
METRIC RANK
84.5%
IN LABOR FORCE | AGE 25-29
28.7/ 100
METRIC RATING
191st/ 347
METRIC RANK
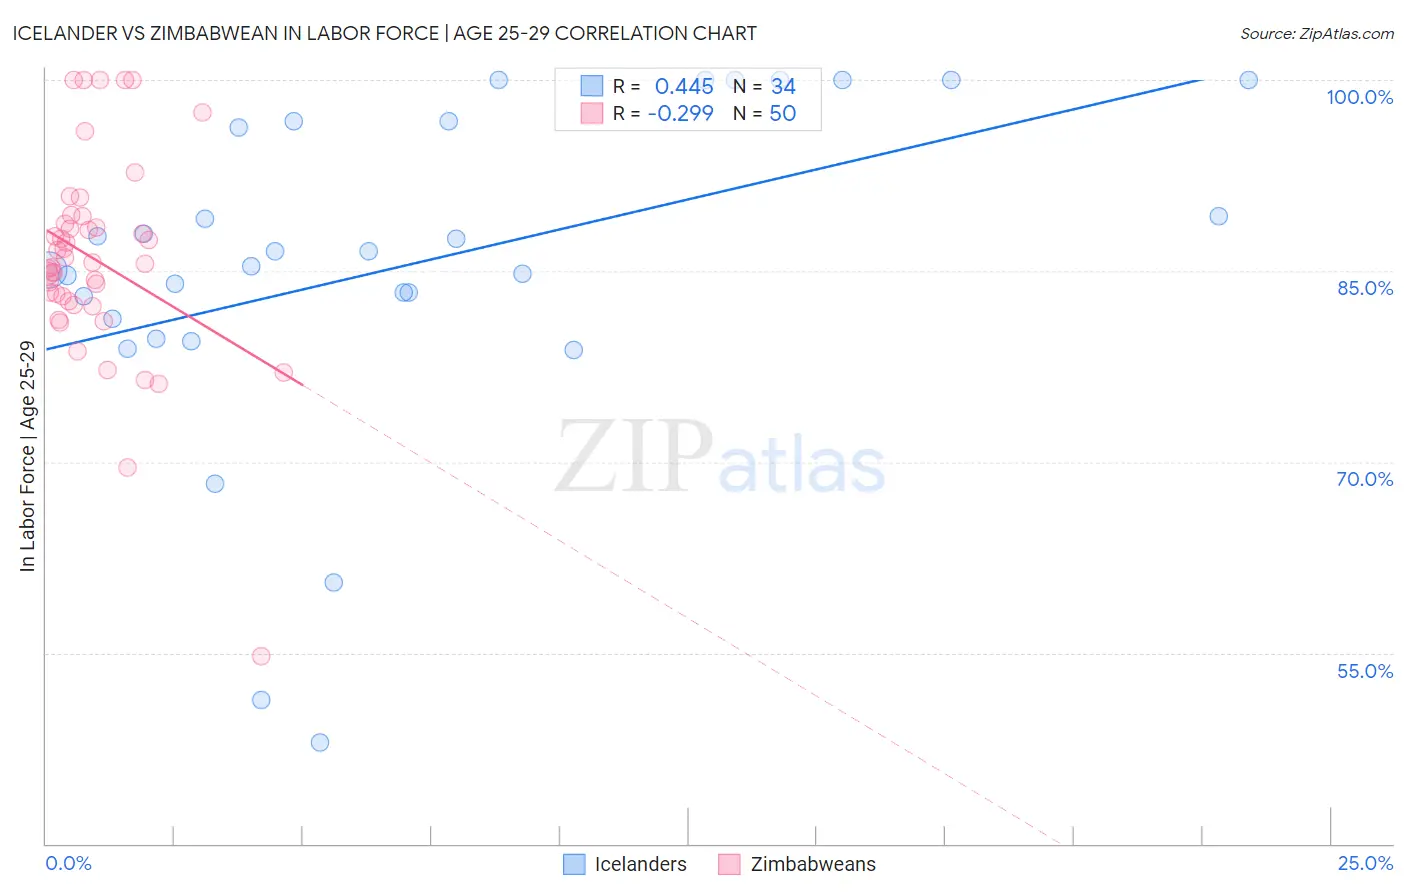
Icelander vs Zimbabwean In Labor Force | Age 25-29 Correlation Chart
The statistical analysis conducted on geographies consisting of 159,638,319 people shows a moderate positive correlation between the proportion of Icelanders and labor force participation rate among population between the ages 25 and 29 in the United States with a correlation coefficient (R) of 0.445 and weighted average of 84.8%. Similarly, the statistical analysis conducted on geographies consisting of 69,201,271 people shows a weak negative correlation between the proportion of Zimbabweans and labor force participation rate among population between the ages 25 and 29 in the United States with a correlation coefficient (R) of -0.299 and weighted average of 84.5%, a difference of 0.31%.
In Labor Force | Age 25-29 Correlation Summary
| Measurement | Icelander | Zimbabwean |
| Minimum | 48.0% | 54.7% |
| Maximum | 100.0% | 100.0% |
| Range | 52.0% | 45.3% |
| Mean | 85.4% | 85.9% |
| Median | 85.9% | 85.6% |
| Interquartile 25% (IQ1) | 81.2% | 82.6% |
| Interquartile 75% (IQ3) | 96.7% | 88.7% |
| Interquartile Range (IQR) | 15.5% | 6.1% |
| Standard Deviation (Sample) | 13.0% | 8.0% |
| Standard Deviation (Population) | 12.8% | 8.0% |
Similar Demographics by In Labor Force | Age 25-29
Demographics Similar to Icelanders by In Labor Force | Age 25-29
In terms of in labor force | age 25-29, the demographic groups most similar to Icelanders are Immigrants from Senegal (84.8%, a difference of 0.0%), Immigrants from Asia (84.8%, a difference of 0.0%), Sri Lankan (84.8%, a difference of 0.010%), Immigrants from Laos (84.8%, a difference of 0.010%), and Pakistani (84.8%, a difference of 0.020%).
| Demographics | Rating | Rank | In Labor Force | Age 25-29 |
| Immigrants | Eastern Asia | 72.6 /100 | #139 | Good 84.8% |
| Immigrants | North America | 72.1 /100 | #140 | Good 84.8% |
| Danes | 71.9 /100 | #141 | Good 84.8% |
| Pakistanis | 70.0 /100 | #142 | Good 84.8% |
| Sri Lankans | 69.2 /100 | #143 | Good 84.8% |
| Immigrants | Laos | 69.0 /100 | #144 | Good 84.8% |
| Immigrants | Senegal | 68.3 /100 | #145 | Good 84.8% |
| Icelanders | 68.2 /100 | #146 | Good 84.8% |
| Immigrants | Asia | 68.2 /100 | #147 | Good 84.8% |
| Immigrants | England | 65.2 /100 | #148 | Good 84.7% |
| Peruvians | 64.7 /100 | #149 | Good 84.7% |
| Swiss | 64.7 /100 | #150 | Good 84.7% |
| Colombians | 62.8 /100 | #151 | Good 84.7% |
| Immigrants | Pakistan | 62.7 /100 | #152 | Good 84.7% |
| Immigrants | Taiwan | 62.2 /100 | #153 | Good 84.7% |
Demographics Similar to Zimbabweans by In Labor Force | Age 25-29
In terms of in labor force | age 25-29, the demographic groups most similar to Zimbabweans are Welsh (84.5%, a difference of 0.020%), Moroccan (84.5%, a difference of 0.030%), English (84.5%, a difference of 0.030%), South American Indian (84.5%, a difference of 0.030%), and Immigrants from Ukraine (84.5%, a difference of 0.040%).
| Demographics | Rating | Rank | In Labor Force | Age 25-29 |
| Immigrants | Kuwait | 38.2 /100 | #184 | Fair 84.6% |
| Immigrants | Denmark | 37.0 /100 | #185 | Fair 84.6% |
| Immigrants | Belgium | 35.0 /100 | #186 | Fair 84.6% |
| Immigrants | Portugal | 34.7 /100 | #187 | Fair 84.6% |
| Immigrants | Ukraine | 33.7 /100 | #188 | Fair 84.5% |
| Moroccans | 32.6 /100 | #189 | Fair 84.5% |
| Welsh | 31.1 /100 | #190 | Fair 84.5% |
| Zimbabweans | 28.7 /100 | #191 | Fair 84.5% |
| English | 25.8 /100 | #192 | Fair 84.5% |
| South American Indians | 25.0 /100 | #193 | Fair 84.5% |
| Portuguese | 21.2 /100 | #194 | Fair 84.4% |
| Immigrants | Israel | 20.8 /100 | #195 | Fair 84.4% |
| Immigrants | South Eastern Asia | 19.5 /100 | #196 | Poor 84.4% |
| Tlingit-Haida | 19.3 /100 | #197 | Poor 84.4% |
| Immigrants | Iraq | 19.0 /100 | #198 | Poor 84.4% |