Icelander vs Immigrants from Greece In Labor Force | Age 25-29
COMPARE
Icelander
Immigrants from Greece
In Labor Force | Age 25-29
In Labor Force | Age 25-29 Comparison
Icelanders
Immigrants from Greece
84.8%
IN LABOR FORCE | AGE 25-29
68.2/ 100
METRIC RATING
146th/ 347
METRIC RANK
85.7%
IN LABOR FORCE | AGE 25-29
99.9/ 100
METRIC RATING
41st/ 347
METRIC RANK
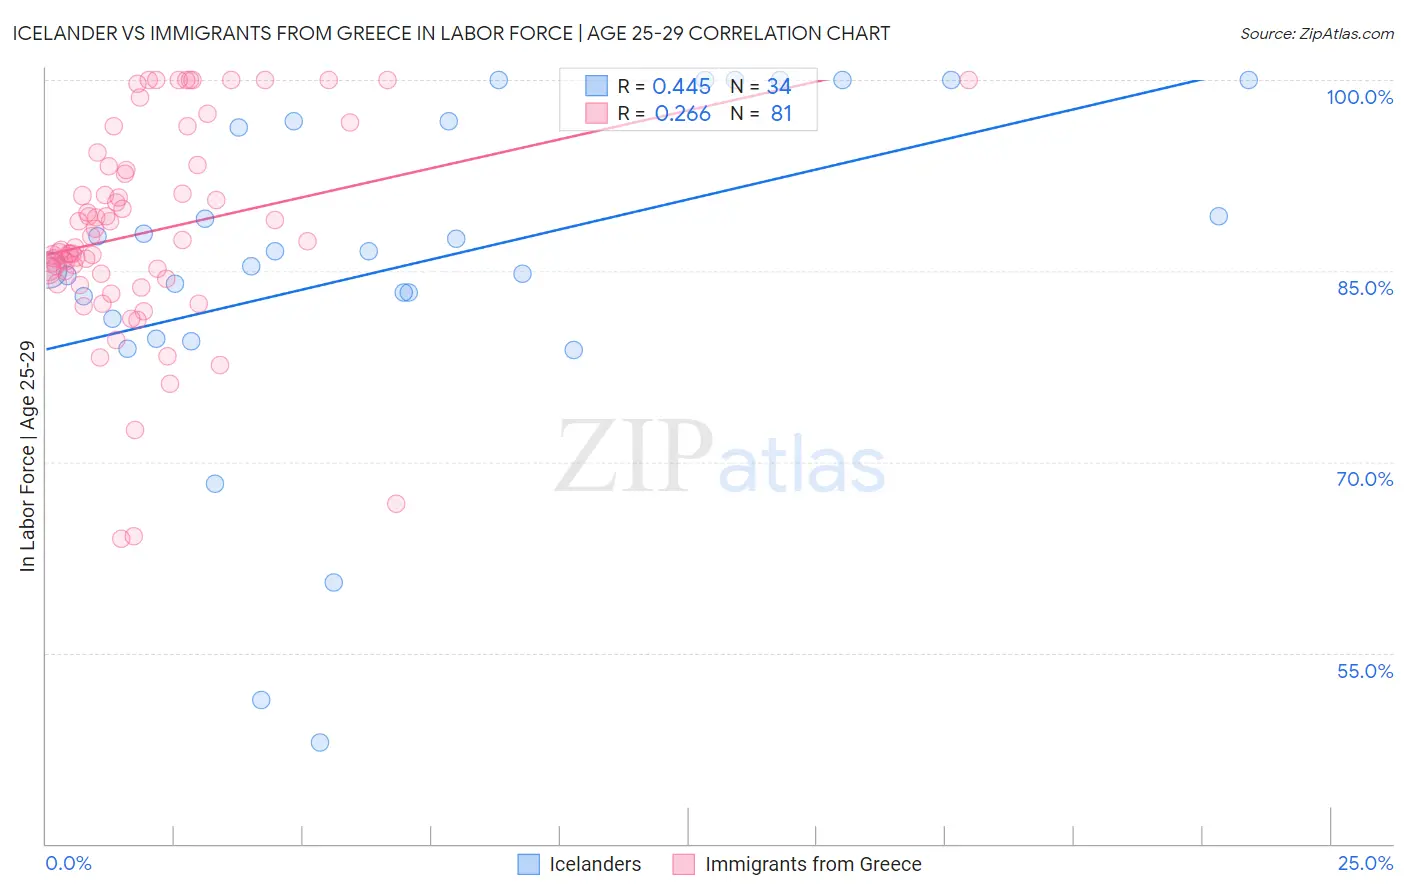
Icelander vs Immigrants from Greece In Labor Force | Age 25-29 Correlation Chart
The statistical analysis conducted on geographies consisting of 159,638,319 people shows a moderate positive correlation between the proportion of Icelanders and labor force participation rate among population between the ages 25 and 29 in the United States with a correlation coefficient (R) of 0.445 and weighted average of 84.8%. Similarly, the statistical analysis conducted on geographies consisting of 216,855,125 people shows a weak positive correlation between the proportion of Immigrants from Greece and labor force participation rate among population between the ages 25 and 29 in the United States with a correlation coefficient (R) of 0.266 and weighted average of 85.7%, a difference of 1.1%.
In Labor Force | Age 25-29 Correlation Summary
| Measurement | Icelander | Immigrants from Greece |
| Minimum | 48.0% | 64.0% |
| Maximum | 100.0% | 100.0% |
| Range | 52.0% | 36.0% |
| Mean | 85.4% | 88.0% |
| Median | 85.9% | 86.8% |
| Interquartile 25% (IQ1) | 81.2% | 84.6% |
| Interquartile 75% (IQ3) | 96.7% | 93.1% |
| Interquartile Range (IQR) | 15.5% | 8.5% |
| Standard Deviation (Sample) | 13.0% | 8.0% |
| Standard Deviation (Population) | 12.8% | 7.9% |
Similar Demographics by In Labor Force | Age 25-29
Demographics Similar to Icelanders by In Labor Force | Age 25-29
In terms of in labor force | age 25-29, the demographic groups most similar to Icelanders are Immigrants from Senegal (84.8%, a difference of 0.0%), Immigrants from Asia (84.8%, a difference of 0.0%), Sri Lankan (84.8%, a difference of 0.010%), Immigrants from Laos (84.8%, a difference of 0.010%), and Pakistani (84.8%, a difference of 0.020%).
| Demographics | Rating | Rank | In Labor Force | Age 25-29 |
| Immigrants | Eastern Asia | 72.6 /100 | #139 | Good 84.8% |
| Immigrants | North America | 72.1 /100 | #140 | Good 84.8% |
| Danes | 71.9 /100 | #141 | Good 84.8% |
| Pakistanis | 70.0 /100 | #142 | Good 84.8% |
| Sri Lankans | 69.2 /100 | #143 | Good 84.8% |
| Immigrants | Laos | 69.0 /100 | #144 | Good 84.8% |
| Immigrants | Senegal | 68.3 /100 | #145 | Good 84.8% |
| Icelanders | 68.2 /100 | #146 | Good 84.8% |
| Immigrants | Asia | 68.2 /100 | #147 | Good 84.8% |
| Immigrants | England | 65.2 /100 | #148 | Good 84.7% |
| Peruvians | 64.7 /100 | #149 | Good 84.7% |
| Swiss | 64.7 /100 | #150 | Good 84.7% |
| Colombians | 62.8 /100 | #151 | Good 84.7% |
| Immigrants | Pakistan | 62.7 /100 | #152 | Good 84.7% |
| Immigrants | Taiwan | 62.2 /100 | #153 | Good 84.7% |
Demographics Similar to Immigrants from Greece by In Labor Force | Age 25-29
In terms of in labor force | age 25-29, the demographic groups most similar to Immigrants from Greece are Immigrants from Albania (85.7%, a difference of 0.010%), Sierra Leonean (85.8%, a difference of 0.030%), Croatian (85.8%, a difference of 0.030%), Immigrants from Eritrea (85.7%, a difference of 0.040%), and Polish (85.8%, a difference of 0.050%).
| Demographics | Rating | Rank | In Labor Force | Age 25-29 |
| Lithuanians | 99.9 /100 | #34 | Exceptional 85.8% |
| Cypriots | 99.9 /100 | #35 | Exceptional 85.8% |
| Immigrants | Nepal | 99.9 /100 | #36 | Exceptional 85.8% |
| Poles | 99.9 /100 | #37 | Exceptional 85.8% |
| Sierra Leoneans | 99.9 /100 | #38 | Exceptional 85.8% |
| Croatians | 99.9 /100 | #39 | Exceptional 85.8% |
| Immigrants | Albania | 99.9 /100 | #40 | Exceptional 85.7% |
| Immigrants | Greece | 99.9 /100 | #41 | Exceptional 85.7% |
| Immigrants | Eritrea | 99.9 /100 | #42 | Exceptional 85.7% |
| Immigrants | India | 99.9 /100 | #43 | Exceptional 85.7% |
| Macedonians | 99.9 /100 | #44 | Exceptional 85.7% |
| Immigrants | Sierra Leone | 99.9 /100 | #45 | Exceptional 85.7% |
| Czechs | 99.8 /100 | #46 | Exceptional 85.6% |
| Turks | 99.8 /100 | #47 | Exceptional 85.6% |
| Italians | 99.8 /100 | #48 | Exceptional 85.6% |