Spanish vs Trinidadian and Tobagonian In Labor Force | Age 25-29
COMPARE
Spanish
Trinidadian and Tobagonian
In Labor Force | Age 25-29
In Labor Force | Age 25-29 Comparison
Spanish
Trinidadians and Tobagonians
83.6%
IN LABOR FORCE | AGE 25-29
0.1/ 100
METRIC RATING
259th/ 347
METRIC RANK
83.9%
IN LABOR FORCE | AGE 25-29
0.7/ 100
METRIC RATING
240th/ 347
METRIC RANK
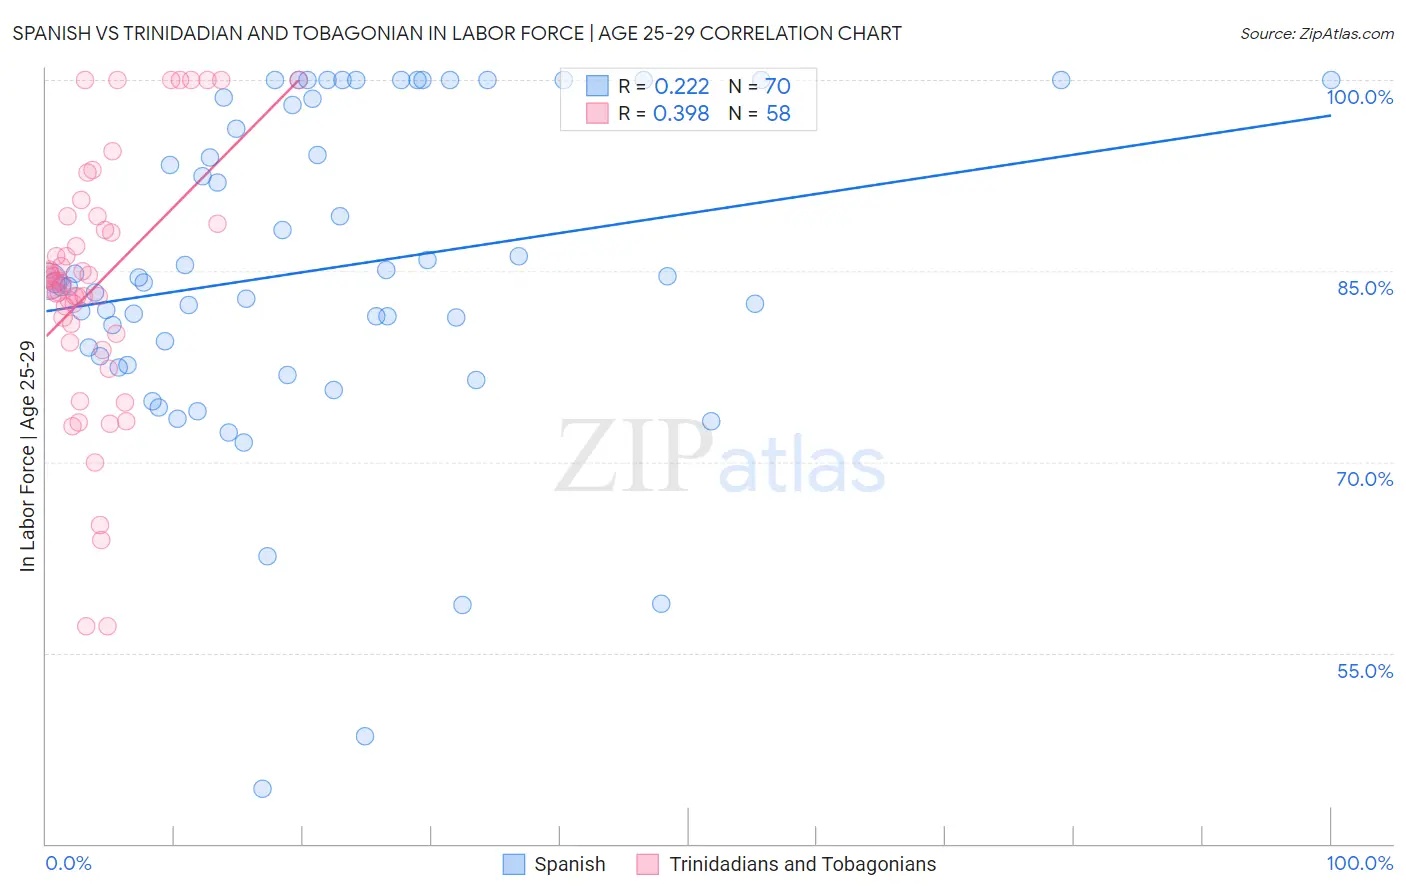
Spanish vs Trinidadian and Tobagonian In Labor Force | Age 25-29 Correlation Chart
The statistical analysis conducted on geographies consisting of 421,954,329 people shows a weak positive correlation between the proportion of Spanish and labor force participation rate among population between the ages 25 and 29 in the United States with a correlation coefficient (R) of 0.222 and weighted average of 83.6%. Similarly, the statistical analysis conducted on geographies consisting of 219,834,546 people shows a mild positive correlation between the proportion of Trinidadians and Tobagonians and labor force participation rate among population between the ages 25 and 29 in the United States with a correlation coefficient (R) of 0.398 and weighted average of 83.9%, a difference of 0.32%.
In Labor Force | Age 25-29 Correlation Summary
| Measurement | Spanish | Trinidadian and Tobagonian |
| Minimum | 44.3% | 57.1% |
| Maximum | 100.0% | 100.0% |
| Range | 55.7% | 42.9% |
| Mean | 85.1% | 83.9% |
| Median | 84.1% | 84.2% |
| Interquartile 25% (IQ1) | 78.3% | 80.1% |
| Interquartile 75% (IQ3) | 98.6% | 88.7% |
| Interquartile Range (IQR) | 20.3% | 8.6% |
| Standard Deviation (Sample) | 12.6% | 10.0% |
| Standard Deviation (Population) | 12.5% | 9.9% |
Demographics Similar to Spanish and Trinidadians and Tobagonians by In Labor Force | Age 25-29
In terms of in labor force | age 25-29, the demographic groups most similar to Spanish are Immigrants from Guatemala (83.6%, a difference of 0.010%), Immigrants from Haiti (83.7%, a difference of 0.050%), Delaware (83.7%, a difference of 0.050%), Haitian (83.7%, a difference of 0.060%), and Guatemalan (83.7%, a difference of 0.080%). Similarly, the demographic groups most similar to Trinidadians and Tobagonians are Jamaican (83.9%, a difference of 0.0%), Alsatian (83.9%, a difference of 0.020%), U.S. Virgin Islander (83.8%, a difference of 0.060%), Salvadoran (83.8%, a difference of 0.070%), and Immigrants from Jamaica (83.8%, a difference of 0.11%).
| Demographics | Rating | Rank | In Labor Force | Age 25-29 |
| Jamaicans | 0.8 /100 | #239 | Tragic 83.9% |
| Trinidadians and Tobagonians | 0.7 /100 | #240 | Tragic 83.9% |
| Alsatians | 0.7 /100 | #241 | Tragic 83.9% |
| U.S. Virgin Islanders | 0.6 /100 | #242 | Tragic 83.8% |
| Salvadorans | 0.5 /100 | #243 | Tragic 83.8% |
| Immigrants | Jamaica | 0.4 /100 | #244 | Tragic 83.8% |
| Iroquois | 0.4 /100 | #245 | Tragic 83.8% |
| Cree | 0.3 /100 | #246 | Tragic 83.8% |
| Immigrants | El Salvador | 0.3 /100 | #247 | Tragic 83.7% |
| Immigrants | Nonimmigrants | 0.3 /100 | #248 | Tragic 83.7% |
| Hmong | 0.3 /100 | #249 | Tragic 83.7% |
| Central Americans | 0.2 /100 | #250 | Tragic 83.7% |
| Bahamians | 0.2 /100 | #251 | Tragic 83.7% |
| Guatemalans | 0.2 /100 | #252 | Tragic 83.7% |
| Immigrants | Trinidad and Tobago | 0.2 /100 | #253 | Tragic 83.7% |
| Spaniards | 0.2 /100 | #254 | Tragic 83.7% |
| Haitians | 0.2 /100 | #255 | Tragic 83.7% |
| Immigrants | Haiti | 0.2 /100 | #256 | Tragic 83.7% |
| Delaware | 0.2 /100 | #257 | Tragic 83.7% |
| Immigrants | Guatemala | 0.1 /100 | #258 | Tragic 83.6% |
| Spanish | 0.1 /100 | #259 | Tragic 83.6% |