Icelander vs Immigrants from Indonesia In Labor Force | Age > 16
COMPARE
Icelander
Immigrants from Indonesia
In Labor Force | Age > 16
In Labor Force | Age > 16 Comparison
Icelanders
Immigrants from Indonesia
65.6%
IN LABOR FORCE | AGE > 16
94.3/ 100
METRIC RATING
131st/ 347
METRIC RANK
65.7%
IN LABOR FORCE | AGE > 16
96.8/ 100
METRIC RATING
115th/ 347
METRIC RANK
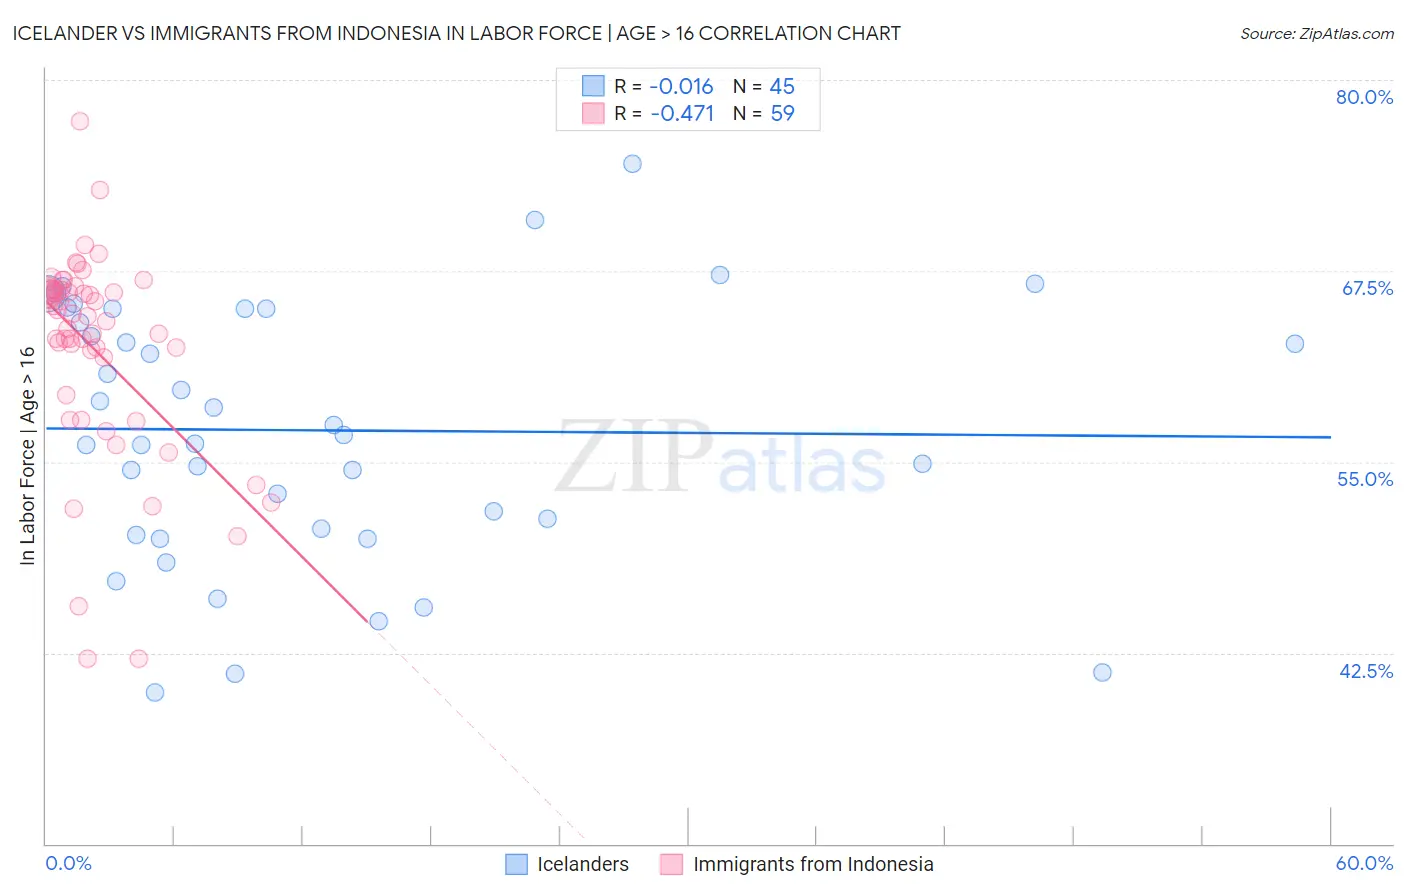
Icelander vs Immigrants from Indonesia In Labor Force | Age > 16 Correlation Chart
The statistical analysis conducted on geographies consisting of 159,668,800 people shows no correlation between the proportion of Icelanders and labor force participation rate among population ages 16 and over in the United States with a correlation coefficient (R) of -0.016 and weighted average of 65.6%. Similarly, the statistical analysis conducted on geographies consisting of 215,789,599 people shows a moderate negative correlation between the proportion of Immigrants from Indonesia and labor force participation rate among population ages 16 and over in the United States with a correlation coefficient (R) of -0.471 and weighted average of 65.7%, a difference of 0.17%.
In Labor Force | Age > 16 Correlation Summary
| Measurement | Icelander | Immigrants from Indonesia |
| Minimum | 39.9% | 42.1% |
| Maximum | 74.5% | 77.3% |
| Range | 34.6% | 35.2% |
| Mean | 57.1% | 62.4% |
| Median | 56.8% | 64.5% |
| Interquartile 25% (IQ1) | 50.4% | 59.4% |
| Interquartile 75% (IQ3) | 65.0% | 66.2% |
| Interquartile Range (IQR) | 14.6% | 6.8% |
| Standard Deviation (Sample) | 8.5% | 6.8% |
| Standard Deviation (Population) | 8.4% | 6.7% |
Demographics Similar to Icelanders and Immigrants from Indonesia by In Labor Force | Age > 16
In terms of in labor force | age > 16, the demographic groups most similar to Icelanders are Immigrants from Guatemala (65.6%, a difference of 0.0%), Immigrants from Philippines (65.6%, a difference of 0.010%), Immigrants from North Macedonia (65.6%, a difference of 0.010%), Ecuadorian (65.6%, a difference of 0.020%), and Immigrants from Eastern Asia (65.7%, a difference of 0.030%). Similarly, the demographic groups most similar to Immigrants from Indonesia are Argentinean (65.7%, a difference of 0.010%), Immigrants from Iran (65.7%, a difference of 0.010%), Immigrants from Thailand (65.7%, a difference of 0.020%), Pakistani (65.8%, a difference of 0.030%), and Honduran (65.8%, a difference of 0.030%).
| Demographics | Rating | Rank | In Labor Force | Age > 16 |
| Pakistanis | 97.1 /100 | #113 | Exceptional 65.8% |
| Hondurans | 97.1 /100 | #114 | Exceptional 65.8% |
| Immigrants | Indonesia | 96.8 /100 | #115 | Exceptional 65.7% |
| Argentineans | 96.7 /100 | #116 | Exceptional 65.7% |
| Immigrants | Iran | 96.6 /100 | #117 | Exceptional 65.7% |
| Immigrants | Thailand | 96.6 /100 | #118 | Exceptional 65.7% |
| Immigrants | France | 96.4 /100 | #119 | Exceptional 65.7% |
| Immigrants | Hong Kong | 96.2 /100 | #120 | Exceptional 65.7% |
| New Zealanders | 96.0 /100 | #121 | Exceptional 65.7% |
| Immigrants | Ecuador | 95.9 /100 | #122 | Exceptional 65.7% |
| Immigrants | Iraq | 95.5 /100 | #123 | Exceptional 65.7% |
| Iraqis | 95.4 /100 | #124 | Exceptional 65.7% |
| Norwegians | 95.3 /100 | #125 | Exceptional 65.7% |
| Koreans | 95.3 /100 | #126 | Exceptional 65.7% |
| Immigrants | Eastern Asia | 94.9 /100 | #127 | Exceptional 65.7% |
| Ecuadorians | 94.7 /100 | #128 | Exceptional 65.6% |
| Immigrants | Philippines | 94.5 /100 | #129 | Exceptional 65.6% |
| Immigrants | Guatemala | 94.4 /100 | #130 | Exceptional 65.6% |
| Icelanders | 94.3 /100 | #131 | Exceptional 65.6% |
| Immigrants | North Macedonia | 94.1 /100 | #132 | Exceptional 65.6% |
| Immigrants | Lithuania | 93.5 /100 | #133 | Exceptional 65.6% |