Icelander vs Jamaican In Labor Force | Age > 16
COMPARE
Icelander
Jamaican
In Labor Force | Age > 16
In Labor Force | Age > 16 Comparison
Icelanders
Jamaicans
65.6%
IN LABOR FORCE | AGE > 16
94.3/ 100
METRIC RATING
131st/ 347
METRIC RANK
64.9%
IN LABOR FORCE | AGE > 16
18.7/ 100
METRIC RATING
205th/ 347
METRIC RANK
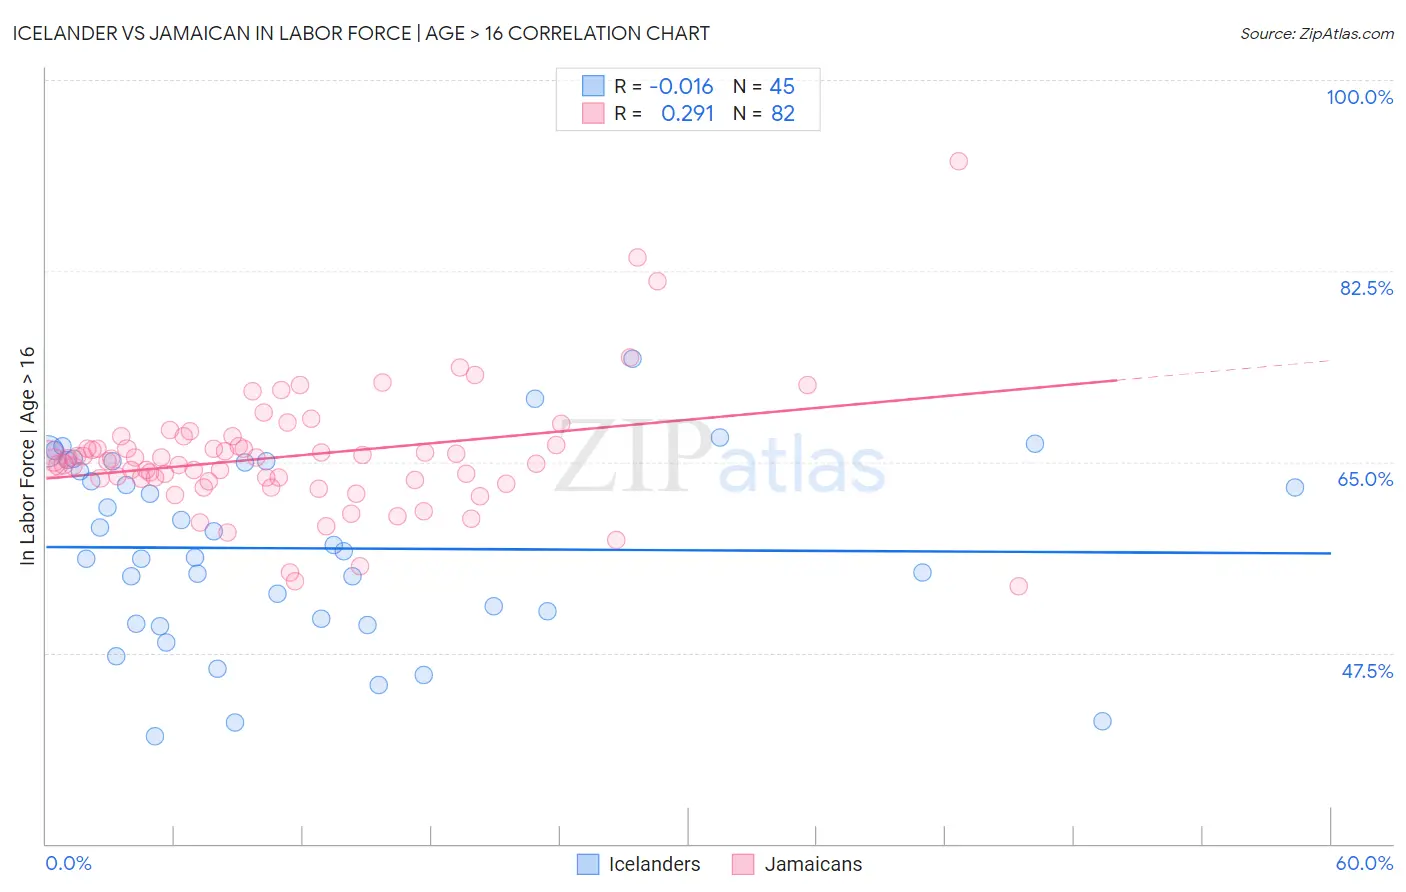
Icelander vs Jamaican In Labor Force | Age > 16 Correlation Chart
The statistical analysis conducted on geographies consisting of 159,668,800 people shows no correlation between the proportion of Icelanders and labor force participation rate among population ages 16 and over in the United States with a correlation coefficient (R) of -0.016 and weighted average of 65.6%. Similarly, the statistical analysis conducted on geographies consisting of 368,080,959 people shows a weak positive correlation between the proportion of Jamaicans and labor force participation rate among population ages 16 and over in the United States with a correlation coefficient (R) of 0.291 and weighted average of 64.9%, a difference of 1.2%.
In Labor Force | Age > 16 Correlation Summary
| Measurement | Icelander | Jamaican |
| Minimum | 39.9% | 53.6% |
| Maximum | 74.5% | 92.6% |
| Range | 34.6% | 39.0% |
| Mean | 57.1% | 65.5% |
| Median | 56.8% | 65.2% |
| Interquartile 25% (IQ1) | 50.4% | 63.4% |
| Interquartile 75% (IQ3) | 65.0% | 66.5% |
| Interquartile Range (IQR) | 14.6% | 3.1% |
| Standard Deviation (Sample) | 8.5% | 5.8% |
| Standard Deviation (Population) | 8.4% | 5.8% |
Similar Demographics by In Labor Force | Age > 16
Demographics Similar to Icelanders by In Labor Force | Age > 16
In terms of in labor force | age > 16, the demographic groups most similar to Icelanders are Immigrants from Guatemala (65.6%, a difference of 0.0%), Immigrants from Philippines (65.6%, a difference of 0.010%), Immigrants from North Macedonia (65.6%, a difference of 0.010%), Ecuadorian (65.6%, a difference of 0.020%), and Immigrants from Eastern Asia (65.7%, a difference of 0.030%).
| Demographics | Rating | Rank | In Labor Force | Age > 16 |
| Iraqis | 95.4 /100 | #124 | Exceptional 65.7% |
| Norwegians | 95.3 /100 | #125 | Exceptional 65.7% |
| Koreans | 95.3 /100 | #126 | Exceptional 65.7% |
| Immigrants | Eastern Asia | 94.9 /100 | #127 | Exceptional 65.7% |
| Ecuadorians | 94.7 /100 | #128 | Exceptional 65.6% |
| Immigrants | Philippines | 94.5 /100 | #129 | Exceptional 65.6% |
| Immigrants | Guatemala | 94.4 /100 | #130 | Exceptional 65.6% |
| Icelanders | 94.3 /100 | #131 | Exceptional 65.6% |
| Immigrants | North Macedonia | 94.1 /100 | #132 | Exceptional 65.6% |
| Immigrants | Lithuania | 93.5 /100 | #133 | Exceptional 65.6% |
| Costa Ricans | 93.2 /100 | #134 | Exceptional 65.6% |
| Guatemalans | 92.5 /100 | #135 | Exceptional 65.6% |
| Immigrants | Argentina | 92.4 /100 | #136 | Exceptional 65.6% |
| Guamanians/Chamorros | 92.4 /100 | #137 | Exceptional 65.6% |
| Immigrants | West Indies | 92.0 /100 | #138 | Exceptional 65.6% |
Demographics Similar to Jamaicans by In Labor Force | Age > 16
In terms of in labor force | age > 16, the demographic groups most similar to Jamaicans are Russian (64.9%, a difference of 0.0%), Slovene (64.9%, a difference of 0.0%), Immigrants from Belgium (64.9%, a difference of 0.010%), Ukrainian (64.9%, a difference of 0.020%), and Armenian (64.9%, a difference of 0.030%).
| Demographics | Rating | Rank | In Labor Force | Age > 16 |
| Greeks | 26.1 /100 | #198 | Fair 64.9% |
| Mexican American Indians | 23.1 /100 | #199 | Fair 64.9% |
| Armenians | 20.2 /100 | #200 | Fair 64.9% |
| Ukrainians | 19.6 /100 | #201 | Poor 64.9% |
| Immigrants | Belgium | 19.4 /100 | #202 | Poor 64.9% |
| Russians | 18.8 /100 | #203 | Poor 64.9% |
| Slovenes | 18.7 /100 | #204 | Poor 64.9% |
| Jamaicans | 18.7 /100 | #205 | Poor 64.9% |
| Lithuanians | 17.4 /100 | #206 | Poor 64.8% |
| Immigrants | Latin America | 16.4 /100 | #207 | Poor 64.8% |
| Belizeans | 16.2 /100 | #208 | Poor 64.8% |
| Immigrants | Trinidad and Tobago | 15.6 /100 | #209 | Poor 64.8% |
| Immigrants | Denmark | 14.7 /100 | #210 | Poor 64.8% |
| Fijians | 14.1 /100 | #211 | Poor 64.8% |
| Alaskan Athabascans | 13.9 /100 | #212 | Poor 64.8% |