Immigrants from Vietnam vs Immigrants from Micronesia In Labor Force | Age 35-44
COMPARE
Immigrants from Vietnam
Immigrants from Micronesia
In Labor Force | Age 35-44
In Labor Force | Age 35-44 Comparison
Immigrants from Vietnam
Immigrants from Micronesia
84.2%
IN LABOR FORCE | AGE 35-44
27.4/ 100
METRIC RATING
192nd/ 347
METRIC RANK
83.1%
IN LABOR FORCE | AGE 35-44
0.0/ 100
METRIC RATING
279th/ 347
METRIC RANK
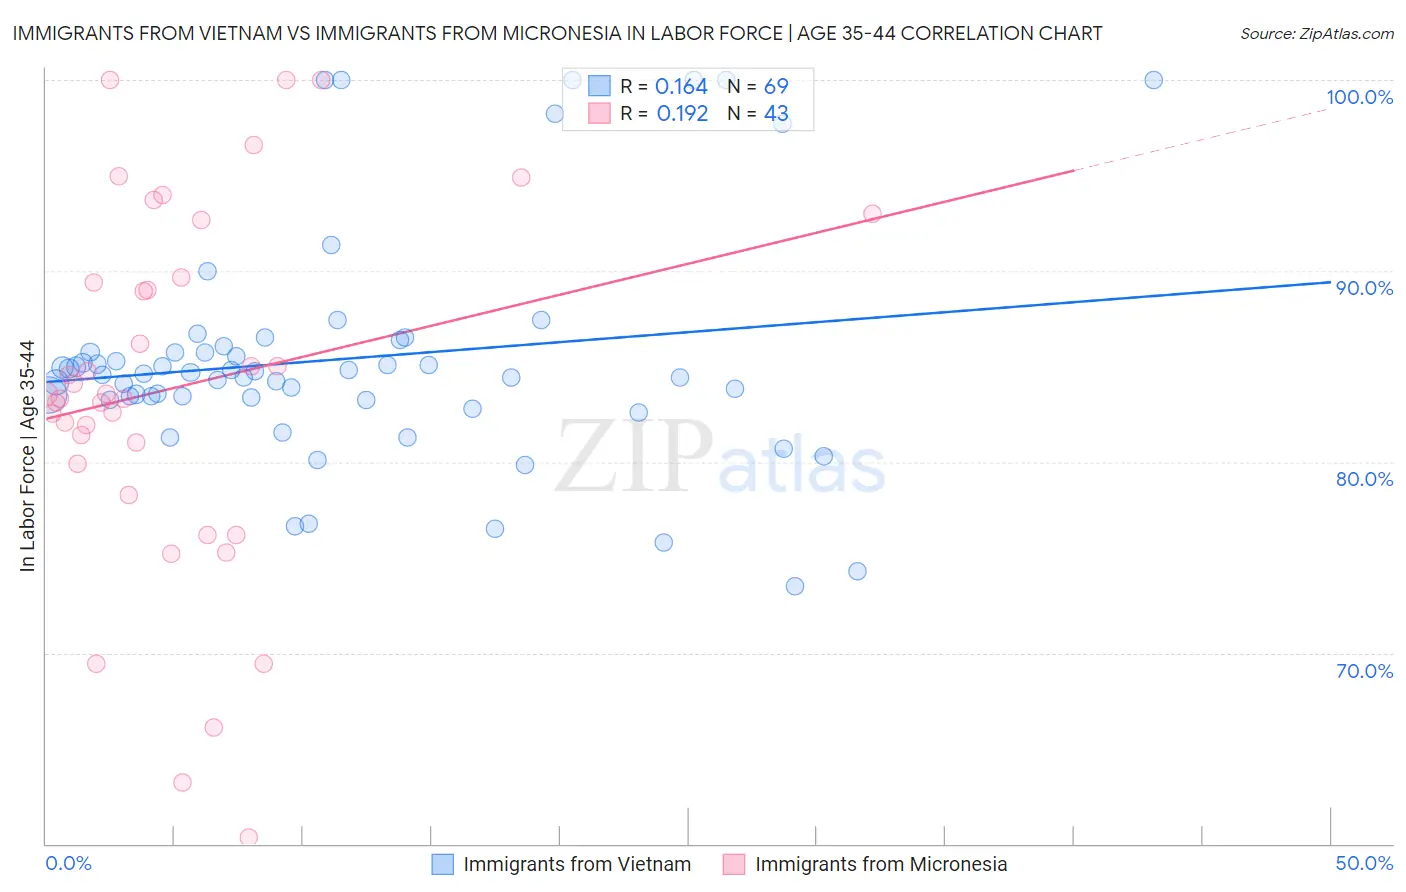
Immigrants from Vietnam vs Immigrants from Micronesia In Labor Force | Age 35-44 Correlation Chart
The statistical analysis conducted on geographies consisting of 404,650,296 people shows a poor positive correlation between the proportion of Immigrants from Vietnam and labor force participation rate among population between the ages 35 and 44 in the United States with a correlation coefficient (R) of 0.164 and weighted average of 84.2%. Similarly, the statistical analysis conducted on geographies consisting of 61,600,178 people shows a poor positive correlation between the proportion of Immigrants from Micronesia and labor force participation rate among population between the ages 35 and 44 in the United States with a correlation coefficient (R) of 0.192 and weighted average of 83.1%, a difference of 1.3%.
In Labor Force | Age 35-44 Correlation Summary
| Measurement | Immigrants from Vietnam | Immigrants from Micronesia |
| Minimum | 73.5% | 60.3% |
| Maximum | 100.0% | 100.0% |
| Range | 26.5% | 39.7% |
| Mean | 85.4% | 83.9% |
| Median | 84.6% | 83.6% |
| Interquartile 25% (IQ1) | 83.3% | 79.9% |
| Interquartile 75% (IQ3) | 85.9% | 89.7% |
| Interquartile Range (IQR) | 2.6% | 9.8% |
| Standard Deviation (Sample) | 6.0% | 9.4% |
| Standard Deviation (Population) | 6.0% | 9.3% |
Similar Demographics by In Labor Force | Age 35-44
Demographics Similar to Immigrants from Vietnam by In Labor Force | Age 35-44
In terms of in labor force | age 35-44, the demographic groups most similar to Immigrants from Vietnam are Immigrants from Philippines (84.2%, a difference of 0.0%), Hungarian (84.2%, a difference of 0.010%), Immigrants from Indonesia (84.2%, a difference of 0.010%), Immigrants from Caribbean (84.2%, a difference of 0.010%), and Immigrants from England (84.2%, a difference of 0.020%).
| Demographics | Rating | Rank | In Labor Force | Age 35-44 |
| Costa Ricans | 35.3 /100 | #185 | Fair 84.3% |
| Australians | 35.1 /100 | #186 | Fair 84.3% |
| Dutch | 34.8 /100 | #187 | Fair 84.3% |
| South Africans | 34.1 /100 | #188 | Fair 84.3% |
| Immigrants | Denmark | 33.7 /100 | #189 | Fair 84.3% |
| Portuguese | 31.9 /100 | #190 | Fair 84.3% |
| Immigrants | Philippines | 27.9 /100 | #191 | Fair 84.2% |
| Immigrants | Vietnam | 27.4 /100 | #192 | Fair 84.2% |
| Hungarians | 26.8 /100 | #193 | Fair 84.2% |
| Immigrants | Indonesia | 25.7 /100 | #194 | Fair 84.2% |
| Immigrants | Caribbean | 25.7 /100 | #195 | Fair 84.2% |
| Immigrants | England | 25.0 /100 | #196 | Fair 84.2% |
| Immigrants | Western Europe | 24.7 /100 | #197 | Fair 84.2% |
| Ecuadorians | 24.0 /100 | #198 | Fair 84.2% |
| Syrians | 23.2 /100 | #199 | Fair 84.2% |
Demographics Similar to Immigrants from Micronesia by In Labor Force | Age 35-44
In terms of in labor force | age 35-44, the demographic groups most similar to Immigrants from Micronesia are Belizean (83.1%, a difference of 0.010%), Dominican (83.1%, a difference of 0.040%), Samoan (83.2%, a difference of 0.080%), Delaware (83.2%, a difference of 0.090%), and Hawaiian (83.2%, a difference of 0.10%).
| Demographics | Rating | Rank | In Labor Force | Age 35-44 |
| Immigrants | Fiji | 0.0 /100 | #272 | Tragic 83.2% |
| Spanish | 0.0 /100 | #273 | Tragic 83.2% |
| Immigrants | Nonimmigrants | 0.0 /100 | #274 | Tragic 83.2% |
| Hawaiians | 0.0 /100 | #275 | Tragic 83.2% |
| Delaware | 0.0 /100 | #276 | Tragic 83.2% |
| Samoans | 0.0 /100 | #277 | Tragic 83.2% |
| Belizeans | 0.0 /100 | #278 | Tragic 83.1% |
| Immigrants | Micronesia | 0.0 /100 | #279 | Tragic 83.1% |
| Dominicans | 0.0 /100 | #280 | Tragic 83.1% |
| Guatemalans | 0.0 /100 | #281 | Tragic 83.0% |
| Osage | 0.0 /100 | #282 | Tragic 82.9% |
| Immigrants | Guatemala | 0.0 /100 | #283 | Tragic 82.9% |
| Immigrants | Dominican Republic | 0.0 /100 | #284 | Tragic 82.9% |
| Fijians | 0.0 /100 | #285 | Tragic 82.9% |
| Immigrants | Bangladesh | 0.0 /100 | #286 | Tragic 82.9% |