Cuban vs Immigrants from Micronesia In Labor Force | Age 35-44
COMPARE
Cuban
Immigrants from Micronesia
In Labor Force | Age 35-44
In Labor Force | Age 35-44 Comparison
Cubans
Immigrants from Micronesia
84.8%
IN LABOR FORCE | AGE 35-44
96.6/ 100
METRIC RATING
96th/ 347
METRIC RANK
83.1%
IN LABOR FORCE | AGE 35-44
0.0/ 100
METRIC RATING
279th/ 347
METRIC RANK
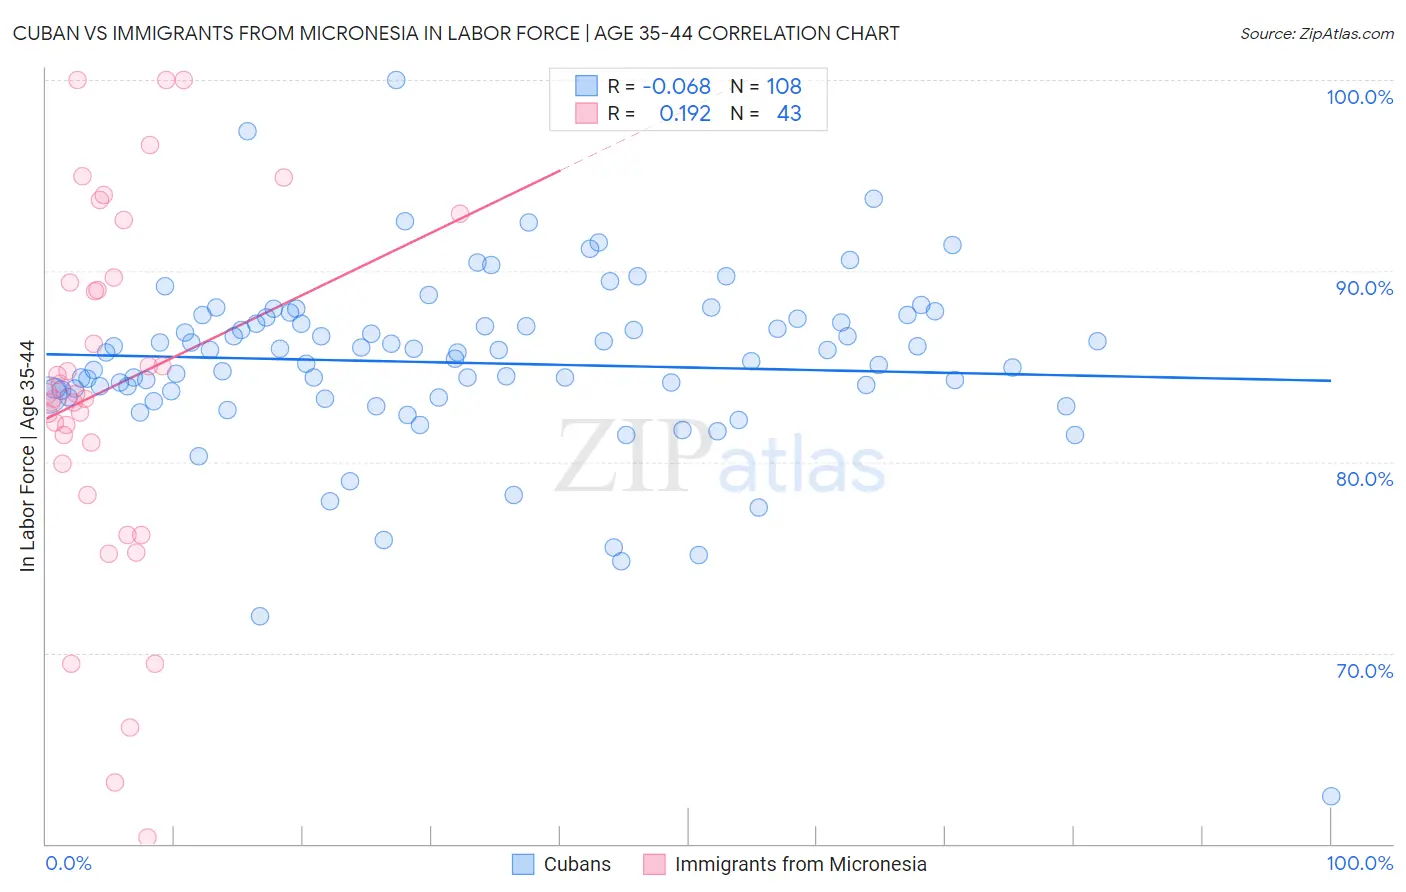
Cuban vs Immigrants from Micronesia In Labor Force | Age 35-44 Correlation Chart
The statistical analysis conducted on geographies consisting of 449,058,980 people shows a slight negative correlation between the proportion of Cubans and labor force participation rate among population between the ages 35 and 44 in the United States with a correlation coefficient (R) of -0.068 and weighted average of 84.8%. Similarly, the statistical analysis conducted on geographies consisting of 61,600,178 people shows a poor positive correlation between the proportion of Immigrants from Micronesia and labor force participation rate among population between the ages 35 and 44 in the United States with a correlation coefficient (R) of 0.192 and weighted average of 83.1%, a difference of 2.1%.
In Labor Force | Age 35-44 Correlation Summary
| Measurement | Cuban | Immigrants from Micronesia |
| Minimum | 62.5% | 60.3% |
| Maximum | 100.0% | 100.0% |
| Range | 37.5% | 39.7% |
| Mean | 85.2% | 83.9% |
| Median | 85.7% | 83.6% |
| Interquartile 25% (IQ1) | 83.6% | 79.9% |
| Interquartile 75% (IQ3) | 87.4% | 89.7% |
| Interquartile Range (IQR) | 3.8% | 9.8% |
| Standard Deviation (Sample) | 4.7% | 9.4% |
| Standard Deviation (Population) | 4.7% | 9.3% |
Similar Demographics by In Labor Force | Age 35-44
Demographics Similar to Cubans by In Labor Force | Age 35-44
In terms of in labor force | age 35-44, the demographic groups most similar to Cubans are Immigrants from Kuwait (84.8%, a difference of 0.0%), Egyptian (84.8%, a difference of 0.0%), Mongolian (84.8%, a difference of 0.010%), Immigrants from Europe (84.9%, a difference of 0.030%), and Ghanaian (84.8%, a difference of 0.030%).
| Demographics | Rating | Rank | In Labor Force | Age 35-44 |
| Immigrants | Pakistan | 97.5 /100 | #89 | Exceptional 84.9% |
| Immigrants | France | 97.4 /100 | #90 | Exceptional 84.9% |
| Immigrants | Europe | 97.2 /100 | #91 | Exceptional 84.9% |
| Ghanaians | 97.2 /100 | #92 | Exceptional 84.8% |
| Immigrants | Northern Africa | 97.1 /100 | #93 | Exceptional 84.8% |
| Mongolians | 96.8 /100 | #94 | Exceptional 84.8% |
| Immigrants | Kuwait | 96.7 /100 | #95 | Exceptional 84.8% |
| Cubans | 96.6 /100 | #96 | Exceptional 84.8% |
| Egyptians | 96.6 /100 | #97 | Exceptional 84.8% |
| Indians (Asian) | 96.1 /100 | #98 | Exceptional 84.8% |
| Haitians | 96.0 /100 | #99 | Exceptional 84.8% |
| Immigrants | Czechoslovakia | 95.9 /100 | #100 | Exceptional 84.8% |
| Immigrants | Australia | 95.5 /100 | #101 | Exceptional 84.8% |
| Immigrants | Southern Europe | 95.3 /100 | #102 | Exceptional 84.8% |
| Immigrants | Belarus | 95.3 /100 | #103 | Exceptional 84.8% |
Demographics Similar to Immigrants from Micronesia by In Labor Force | Age 35-44
In terms of in labor force | age 35-44, the demographic groups most similar to Immigrants from Micronesia are Belizean (83.1%, a difference of 0.010%), Dominican (83.1%, a difference of 0.040%), Samoan (83.2%, a difference of 0.080%), Delaware (83.2%, a difference of 0.090%), and Hawaiian (83.2%, a difference of 0.10%).
| Demographics | Rating | Rank | In Labor Force | Age 35-44 |
| Immigrants | Fiji | 0.0 /100 | #272 | Tragic 83.2% |
| Spanish | 0.0 /100 | #273 | Tragic 83.2% |
| Immigrants | Nonimmigrants | 0.0 /100 | #274 | Tragic 83.2% |
| Hawaiians | 0.0 /100 | #275 | Tragic 83.2% |
| Delaware | 0.0 /100 | #276 | Tragic 83.2% |
| Samoans | 0.0 /100 | #277 | Tragic 83.2% |
| Belizeans | 0.0 /100 | #278 | Tragic 83.1% |
| Immigrants | Micronesia | 0.0 /100 | #279 | Tragic 83.1% |
| Dominicans | 0.0 /100 | #280 | Tragic 83.1% |
| Guatemalans | 0.0 /100 | #281 | Tragic 83.0% |
| Osage | 0.0 /100 | #282 | Tragic 82.9% |
| Immigrants | Guatemala | 0.0 /100 | #283 | Tragic 82.9% |
| Immigrants | Dominican Republic | 0.0 /100 | #284 | Tragic 82.9% |
| Fijians | 0.0 /100 | #285 | Tragic 82.9% |
| Immigrants | Bangladesh | 0.0 /100 | #286 | Tragic 82.9% |