Houma vs Belgian In Labor Force | Age 20-64
COMPARE
Houma
Belgian
In Labor Force | Age 20-64
In Labor Force | Age 20-64 Comparison
Houma
Belgians
72.7%
IN LABOR FORCE | AGE 20-64
0.0/ 100
METRIC RATING
339th/ 347
METRIC RANK
79.9%
IN LABOR FORCE | AGE 20-64
87.4/ 100
METRIC RATING
134th/ 347
METRIC RANK
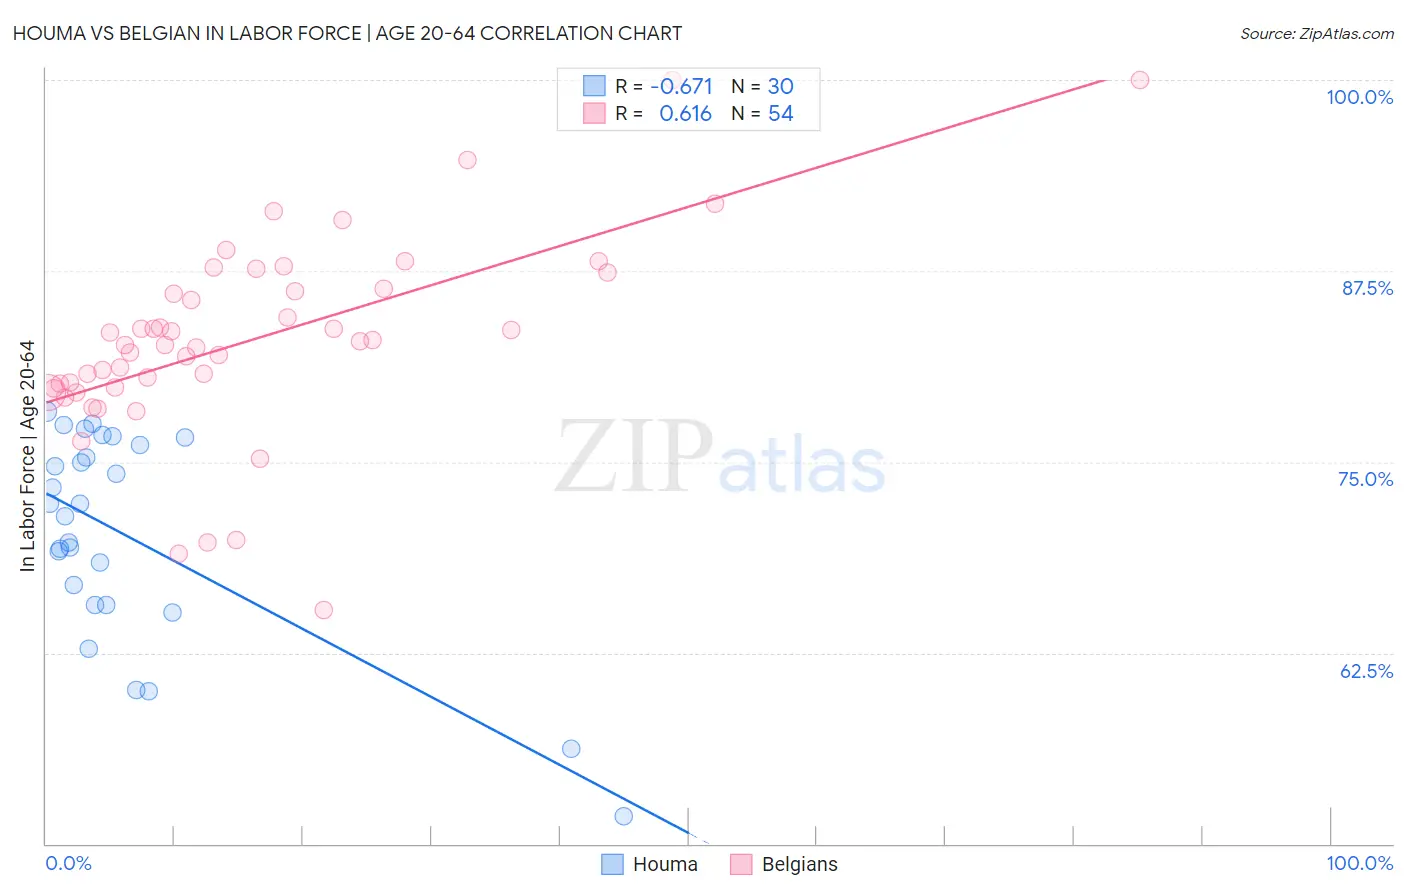
Houma vs Belgian In Labor Force | Age 20-64 Correlation Chart
The statistical analysis conducted on geographies consisting of 36,797,748 people shows a significant negative correlation between the proportion of Houma and labor force participation rate among population between the ages 20 and 64 in the United States with a correlation coefficient (R) of -0.671 and weighted average of 72.7%. Similarly, the statistical analysis conducted on geographies consisting of 356,033,088 people shows a significant positive correlation between the proportion of Belgians and labor force participation rate among population between the ages 20 and 64 in the United States with a correlation coefficient (R) of 0.616 and weighted average of 79.9%, a difference of 9.8%.
In Labor Force | Age 20-64 Correlation Summary
| Measurement | Houma | Belgian |
| Minimum | 51.8% | 65.3% |
| Maximum | 78.3% | 100.0% |
| Range | 26.5% | 34.7% |
| Mean | 70.2% | 83.0% |
| Median | 71.9% | 82.8% |
| Interquartile 25% (IQ1) | 65.6% | 79.9% |
| Interquartile 75% (IQ3) | 76.1% | 86.3% |
| Interquartile Range (IQR) | 10.5% | 6.4% |
| Standard Deviation (Sample) | 6.9% | 6.5% |
| Standard Deviation (Population) | 6.7% | 6.5% |
Similar Demographics by In Labor Force | Age 20-64
Demographics Similar to Houma by In Labor Force | Age 20-64
In terms of in labor force | age 20-64, the demographic groups most similar to Houma are Pueblo (72.6%, a difference of 0.15%), Puerto Rican (73.1%, a difference of 0.43%), Yup'ik (73.2%, a difference of 0.64%), Immigrants from Yemen (72.3%, a difference of 0.64%), and Crow (73.3%, a difference of 0.76%).
| Demographics | Rating | Rank | In Labor Force | Age 20-64 |
| Arapaho | 0.0 /100 | #332 | Tragic 74.4% |
| Natives/Alaskans | 0.0 /100 | #333 | Tragic 73.9% |
| Apache | 0.0 /100 | #334 | Tragic 73.7% |
| Ute | 0.0 /100 | #335 | Tragic 73.7% |
| Crow | 0.0 /100 | #336 | Tragic 73.3% |
| Yup'ik | 0.0 /100 | #337 | Tragic 73.2% |
| Puerto Ricans | 0.0 /100 | #338 | Tragic 73.1% |
| Houma | 0.0 /100 | #339 | Tragic 72.7% |
| Pueblo | 0.0 /100 | #340 | Tragic 72.6% |
| Immigrants | Yemen | 0.0 /100 | #341 | Tragic 72.3% |
| Yuman | 0.0 /100 | #342 | Tragic 71.7% |
| Hopi | 0.0 /100 | #343 | Tragic 71.7% |
| Lumbee | 0.0 /100 | #344 | Tragic 70.6% |
| Tohono O'odham | 0.0 /100 | #345 | Tragic 70.4% |
| Navajo | 0.0 /100 | #346 | Tragic 69.2% |
Demographics Similar to Belgians by In Labor Force | Age 20-64
In terms of in labor force | age 20-64, the demographic groups most similar to Belgians are Indian (Asian) (79.9%, a difference of 0.0%), South American Indian (79.9%, a difference of 0.0%), Ukrainian (79.9%, a difference of 0.010%), Immigrants from Singapore (79.9%, a difference of 0.010%), and Immigrants from Zaire (79.9%, a difference of 0.020%).
| Demographics | Rating | Rank | In Labor Force | Age 20-64 |
| Immigrants | Czechoslovakia | 89.7 /100 | #127 | Excellent 79.9% |
| Immigrants | Eastern Asia | 89.4 /100 | #128 | Excellent 79.9% |
| Italians | 88.9 /100 | #129 | Excellent 79.9% |
| Immigrants | Zaire | 88.6 /100 | #130 | Excellent 79.9% |
| Immigrants | Iran | 88.3 /100 | #131 | Excellent 79.9% |
| Indians (Asian) | 87.7 /100 | #132 | Excellent 79.9% |
| South American Indians | 87.6 /100 | #133 | Excellent 79.9% |
| Belgians | 87.4 /100 | #134 | Excellent 79.9% |
| Ukrainians | 86.8 /100 | #135 | Excellent 79.9% |
| Immigrants | Singapore | 86.7 /100 | #136 | Excellent 79.9% |
| Immigrants | Ukraine | 86.5 /100 | #137 | Excellent 79.9% |
| Immigrants | Nigeria | 86.4 /100 | #138 | Excellent 79.9% |
| Immigrants | Spain | 83.9 /100 | #139 | Excellent 79.8% |
| Immigrants | South Eastern Asia | 80.4 /100 | #140 | Excellent 79.8% |
| Immigrants | Israel | 80.0 /100 | #141 | Good 79.8% |