Immigrants from Fiji vs Immigrants from Afghanistan In Labor Force | Age 16-19
COMPARE
Immigrants from Fiji
Immigrants from Afghanistan
In Labor Force | Age 16-19
In Labor Force | Age 16-19 Comparison
Immigrants from Fiji
Immigrants from Afghanistan
33.9%
IN LABOR FORCE | AGE 16-19
0.3/ 100
METRIC RATING
275th/ 347
METRIC RANK
36.3%
IN LABOR FORCE | AGE 16-19
34.0/ 100
METRIC RATING
187th/ 347
METRIC RANK
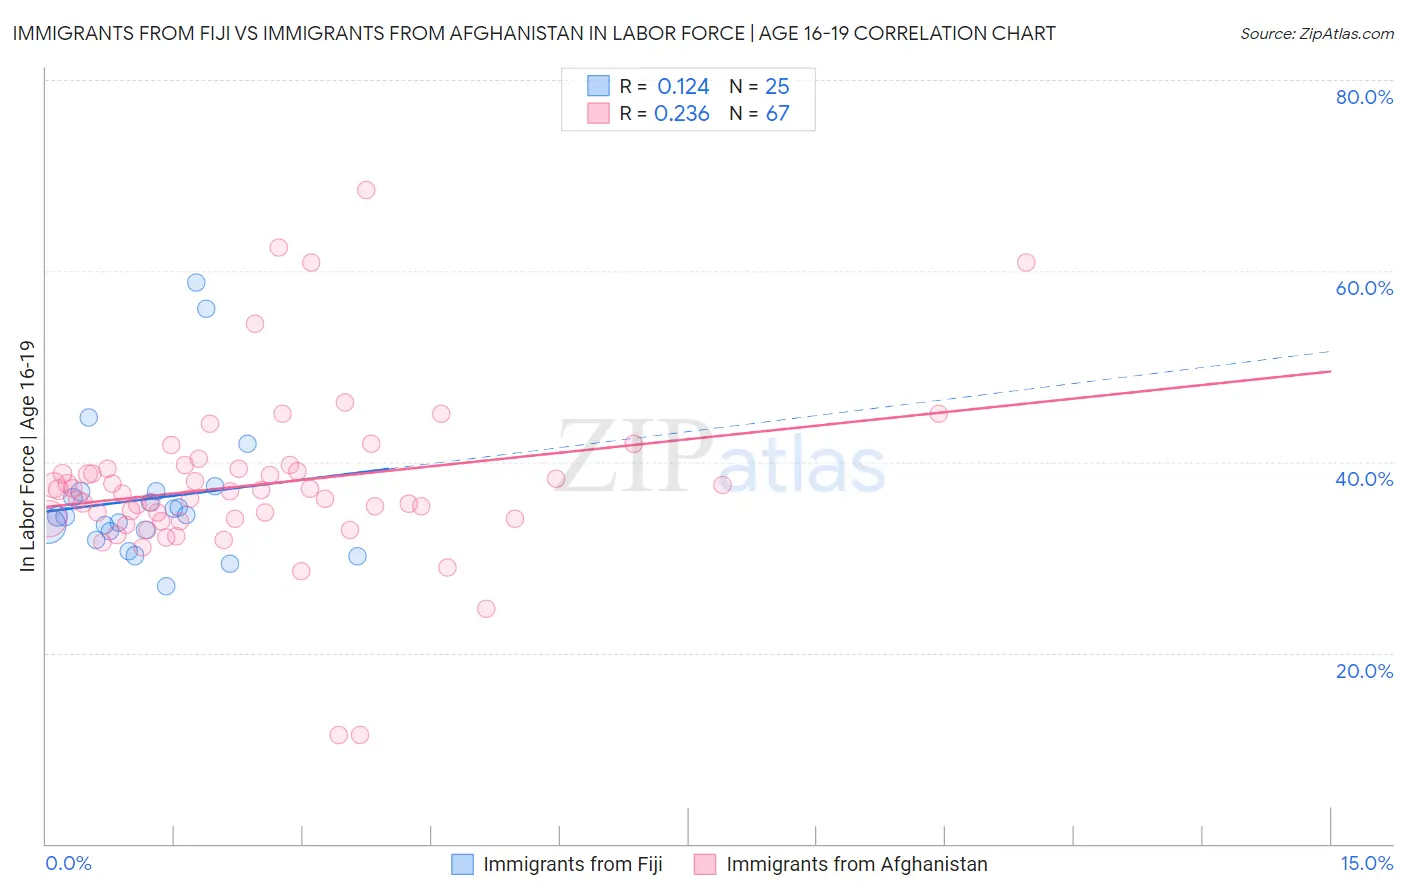
Immigrants from Fiji vs Immigrants from Afghanistan In Labor Force | Age 16-19 Correlation Chart
The statistical analysis conducted on geographies consisting of 93,728,975 people shows a poor positive correlation between the proportion of Immigrants from Fiji and labor force participation rate among population between the ages 16 and 19 in the United States with a correlation coefficient (R) of 0.124 and weighted average of 33.9%. Similarly, the statistical analysis conducted on geographies consisting of 147,514,090 people shows a weak positive correlation between the proportion of Immigrants from Afghanistan and labor force participation rate among population between the ages 16 and 19 in the United States with a correlation coefficient (R) of 0.236 and weighted average of 36.3%, a difference of 6.9%.
In Labor Force | Age 16-19 Correlation Summary
| Measurement | Immigrants from Fiji | Immigrants from Afghanistan |
| Minimum | 26.9% | 11.4% |
| Maximum | 58.8% | 68.5% |
| Range | 31.9% | 57.1% |
| Mean | 36.1% | 37.7% |
| Median | 34.3% | 36.9% |
| Interquartile 25% (IQ1) | 32.3% | 34.0% |
| Interquartile 75% (IQ3) | 36.9% | 39.3% |
| Interquartile Range (IQR) | 4.6% | 5.3% |
| Standard Deviation (Sample) | 7.4% | 9.0% |
| Standard Deviation (Population) | 7.3% | 9.0% |
Similar Demographics by In Labor Force | Age 16-19
Demographics Similar to Immigrants from Fiji by In Labor Force | Age 16-19
In terms of in labor force | age 16-19, the demographic groups most similar to Immigrants from Fiji are Venezuelan (34.0%, a difference of 0.090%), Immigrants from Latin America (33.9%, a difference of 0.10%), Immigrants from Panama (34.0%, a difference of 0.18%), Menominee (33.9%, a difference of 0.22%), and Colombian (33.8%, a difference of 0.29%).
| Demographics | Rating | Rank | In Labor Force | Age 16-19 |
| Immigrants | Asia | 0.5 /100 | #268 | Tragic 34.1% |
| Pima | 0.5 /100 | #269 | Tragic 34.1% |
| Immigrants | Russia | 0.4 /100 | #270 | Tragic 34.1% |
| Central American Indians | 0.4 /100 | #271 | Tragic 34.1% |
| Asians | 0.4 /100 | #272 | Tragic 34.1% |
| Immigrants | Panama | 0.4 /100 | #273 | Tragic 34.0% |
| Venezuelans | 0.3 /100 | #274 | Tragic 34.0% |
| Immigrants | Fiji | 0.3 /100 | #275 | Tragic 33.9% |
| Immigrants | Latin America | 0.3 /100 | #276 | Tragic 33.9% |
| Menominee | 0.3 /100 | #277 | Tragic 33.9% |
| Colombians | 0.3 /100 | #278 | Tragic 33.8% |
| Paraguayans | 0.3 /100 | #279 | Tragic 33.8% |
| Taiwanese | 0.3 /100 | #280 | Tragic 33.8% |
| Cypriots | 0.3 /100 | #281 | Tragic 33.8% |
| Immigrants | Korea | 0.3 /100 | #282 | Tragic 33.8% |
Demographics Similar to Immigrants from Afghanistan by In Labor Force | Age 16-19
In terms of in labor force | age 16-19, the demographic groups most similar to Immigrants from Afghanistan are Immigrants from Romania (36.3%, a difference of 0.0%), Bhutanese (36.3%, a difference of 0.080%), Costa Rican (36.3%, a difference of 0.12%), Immigrants from Europe (36.2%, a difference of 0.13%), and Eastern European (36.4%, a difference of 0.27%).
| Demographics | Rating | Rank | In Labor Force | Age 16-19 |
| Immigrants | Morocco | 41.1 /100 | #180 | Average 36.4% |
| Jordanians | 39.6 /100 | #181 | Fair 36.4% |
| Immigrants | Italy | 39.1 /100 | #182 | Fair 36.4% |
| Eastern Europeans | 38.8 /100 | #183 | Fair 36.4% |
| Costa Ricans | 36.1 /100 | #184 | Fair 36.3% |
| Bhutanese | 35.3 /100 | #185 | Fair 36.3% |
| Immigrants | Romania | 34.0 /100 | #186 | Fair 36.3% |
| Immigrants | Afghanistan | 34.0 /100 | #187 | Fair 36.3% |
| Immigrants | Europe | 31.8 /100 | #188 | Fair 36.2% |
| Immigrants | Hungary | 28.8 /100 | #189 | Fair 36.2% |
| Panamanians | 28.6 /100 | #190 | Fair 36.1% |
| Immigrants | Croatia | 27.5 /100 | #191 | Fair 36.1% |
| Afghans | 25.7 /100 | #192 | Fair 36.1% |
| Immigrants | Denmark | 25.0 /100 | #193 | Fair 36.1% |
| Nigerians | 24.6 /100 | #194 | Fair 36.1% |