Hawaiian vs Immigrants from Afghanistan In Labor Force | Age 16-19
COMPARE
Hawaiian
Immigrants from Afghanistan
In Labor Force | Age 16-19
In Labor Force | Age 16-19 Comparison
Hawaiians
Immigrants from Afghanistan
38.4%
IN LABOR FORCE | AGE 16-19
98.2/ 100
METRIC RATING
114th/ 347
METRIC RANK
36.3%
IN LABOR FORCE | AGE 16-19
34.0/ 100
METRIC RATING
187th/ 347
METRIC RANK
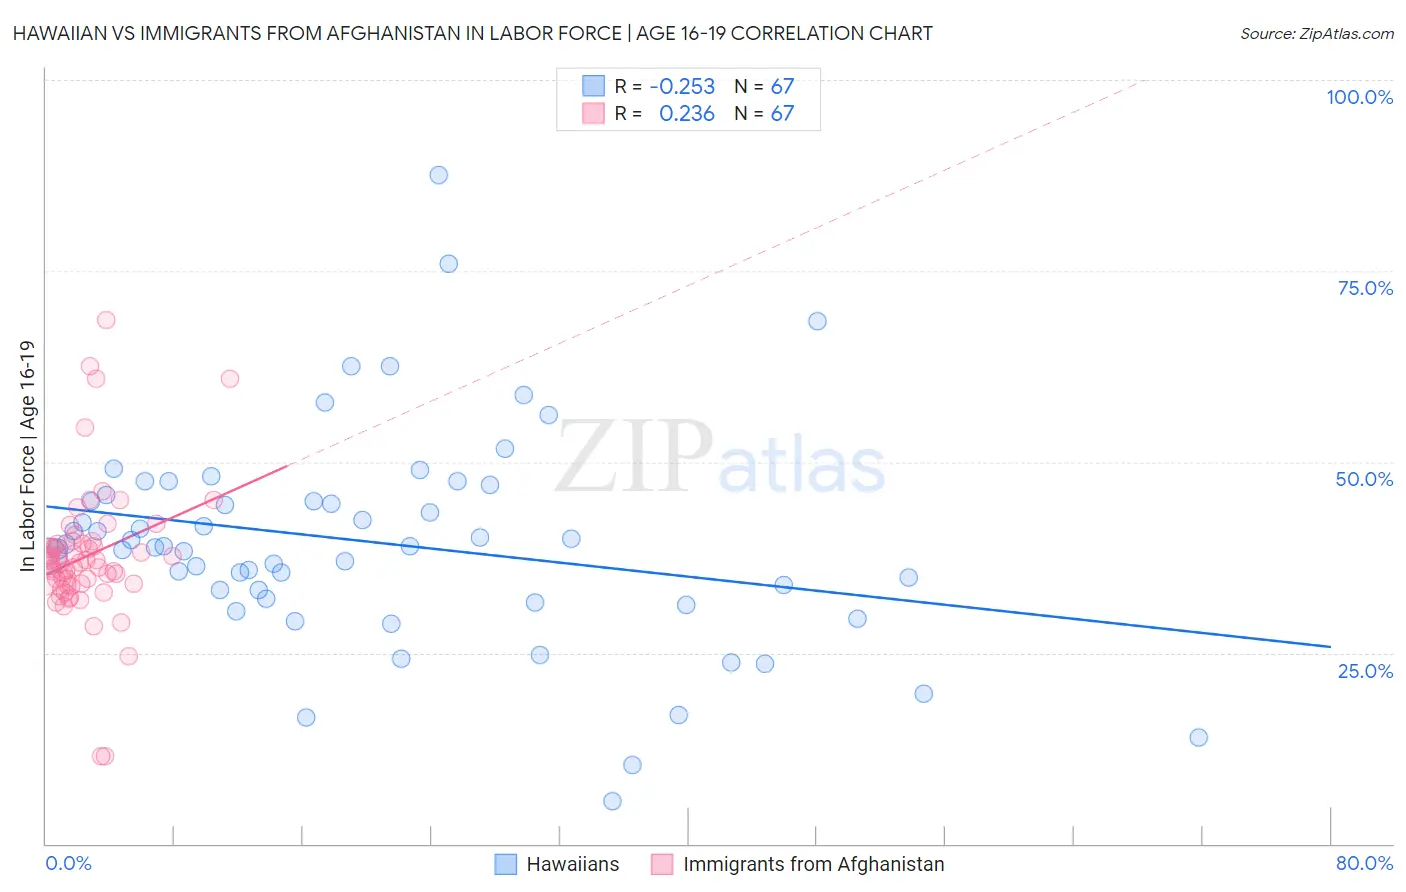
Hawaiian vs Immigrants from Afghanistan In Labor Force | Age 16-19 Correlation Chart
The statistical analysis conducted on geographies consisting of 327,147,423 people shows a weak negative correlation between the proportion of Hawaiians and labor force participation rate among population between the ages 16 and 19 in the United States with a correlation coefficient (R) of -0.253 and weighted average of 38.4%. Similarly, the statistical analysis conducted on geographies consisting of 147,514,090 people shows a weak positive correlation between the proportion of Immigrants from Afghanistan and labor force participation rate among population between the ages 16 and 19 in the United States with a correlation coefficient (R) of 0.236 and weighted average of 36.3%, a difference of 5.9%.
In Labor Force | Age 16-19 Correlation Summary
| Measurement | Hawaiian | Immigrants from Afghanistan |
| Minimum | 5.6% | 11.4% |
| Maximum | 87.5% | 68.5% |
| Range | 81.9% | 57.1% |
| Mean | 39.4% | 37.7% |
| Median | 38.9% | 36.9% |
| Interquartile 25% (IQ1) | 32.1% | 34.0% |
| Interquartile 75% (IQ3) | 45.6% | 39.3% |
| Interquartile Range (IQR) | 13.5% | 5.3% |
| Standard Deviation (Sample) | 14.1% | 9.0% |
| Standard Deviation (Population) | 14.0% | 9.0% |
Similar Demographics by In Labor Force | Age 16-19
Demographics Similar to Hawaiians by In Labor Force | Age 16-19
In terms of in labor force | age 16-19, the demographic groups most similar to Hawaiians are Subsaharan African (38.4%, a difference of 0.10%), Bulgarian (38.3%, a difference of 0.15%), Colville (38.3%, a difference of 0.15%), Chickasaw (38.3%, a difference of 0.20%), and Immigrants from Nepal (38.3%, a difference of 0.21%).
| Demographics | Rating | Rank | In Labor Force | Age 16-19 |
| Chinese | 98.8 /100 | #107 | Exceptional 38.6% |
| Immigrants | Ethiopia | 98.7 /100 | #108 | Exceptional 38.6% |
| Lebanese | 98.7 /100 | #109 | Exceptional 38.6% |
| Maltese | 98.6 /100 | #110 | Exceptional 38.5% |
| Crow | 98.5 /100 | #111 | Exceptional 38.5% |
| Immigrants | Scotland | 98.5 /100 | #112 | Exceptional 38.5% |
| Sub-Saharan Africans | 98.3 /100 | #113 | Exceptional 38.4% |
| Hawaiians | 98.2 /100 | #114 | Exceptional 38.4% |
| Bulgarians | 97.9 /100 | #115 | Exceptional 38.3% |
| Colville | 97.9 /100 | #116 | Exceptional 38.3% |
| Chickasaw | 97.8 /100 | #117 | Exceptional 38.3% |
| Immigrants | Nepal | 97.8 /100 | #118 | Exceptional 38.3% |
| Assyrians/Chaldeans/Syriacs | 97.8 /100 | #119 | Exceptional 38.3% |
| Ukrainians | 97.6 /100 | #120 | Exceptional 38.3% |
| Ethiopians | 97.4 /100 | #121 | Exceptional 38.2% |
Demographics Similar to Immigrants from Afghanistan by In Labor Force | Age 16-19
In terms of in labor force | age 16-19, the demographic groups most similar to Immigrants from Afghanistan are Immigrants from Romania (36.3%, a difference of 0.0%), Bhutanese (36.3%, a difference of 0.080%), Costa Rican (36.3%, a difference of 0.12%), Immigrants from Europe (36.2%, a difference of 0.13%), and Eastern European (36.4%, a difference of 0.27%).
| Demographics | Rating | Rank | In Labor Force | Age 16-19 |
| Immigrants | Morocco | 41.1 /100 | #180 | Average 36.4% |
| Jordanians | 39.6 /100 | #181 | Fair 36.4% |
| Immigrants | Italy | 39.1 /100 | #182 | Fair 36.4% |
| Eastern Europeans | 38.8 /100 | #183 | Fair 36.4% |
| Costa Ricans | 36.1 /100 | #184 | Fair 36.3% |
| Bhutanese | 35.3 /100 | #185 | Fair 36.3% |
| Immigrants | Romania | 34.0 /100 | #186 | Fair 36.3% |
| Immigrants | Afghanistan | 34.0 /100 | #187 | Fair 36.3% |
| Immigrants | Europe | 31.8 /100 | #188 | Fair 36.2% |
| Immigrants | Hungary | 28.8 /100 | #189 | Fair 36.2% |
| Panamanians | 28.6 /100 | #190 | Fair 36.1% |
| Immigrants | Croatia | 27.5 /100 | #191 | Fair 36.1% |
| Afghans | 25.7 /100 | #192 | Fair 36.1% |
| Immigrants | Denmark | 25.0 /100 | #193 | Fair 36.1% |
| Nigerians | 24.6 /100 | #194 | Fair 36.1% |