Serbian vs Immigrants from Afghanistan In Labor Force | Age 16-19
COMPARE
Serbian
Immigrants from Afghanistan
In Labor Force | Age 16-19
In Labor Force | Age 16-19 Comparison
Serbians
Immigrants from Afghanistan
39.9%
IN LABOR FORCE | AGE 16-19
99.9/ 100
METRIC RATING
71st/ 347
METRIC RANK
36.3%
IN LABOR FORCE | AGE 16-19
34.0/ 100
METRIC RATING
187th/ 347
METRIC RANK
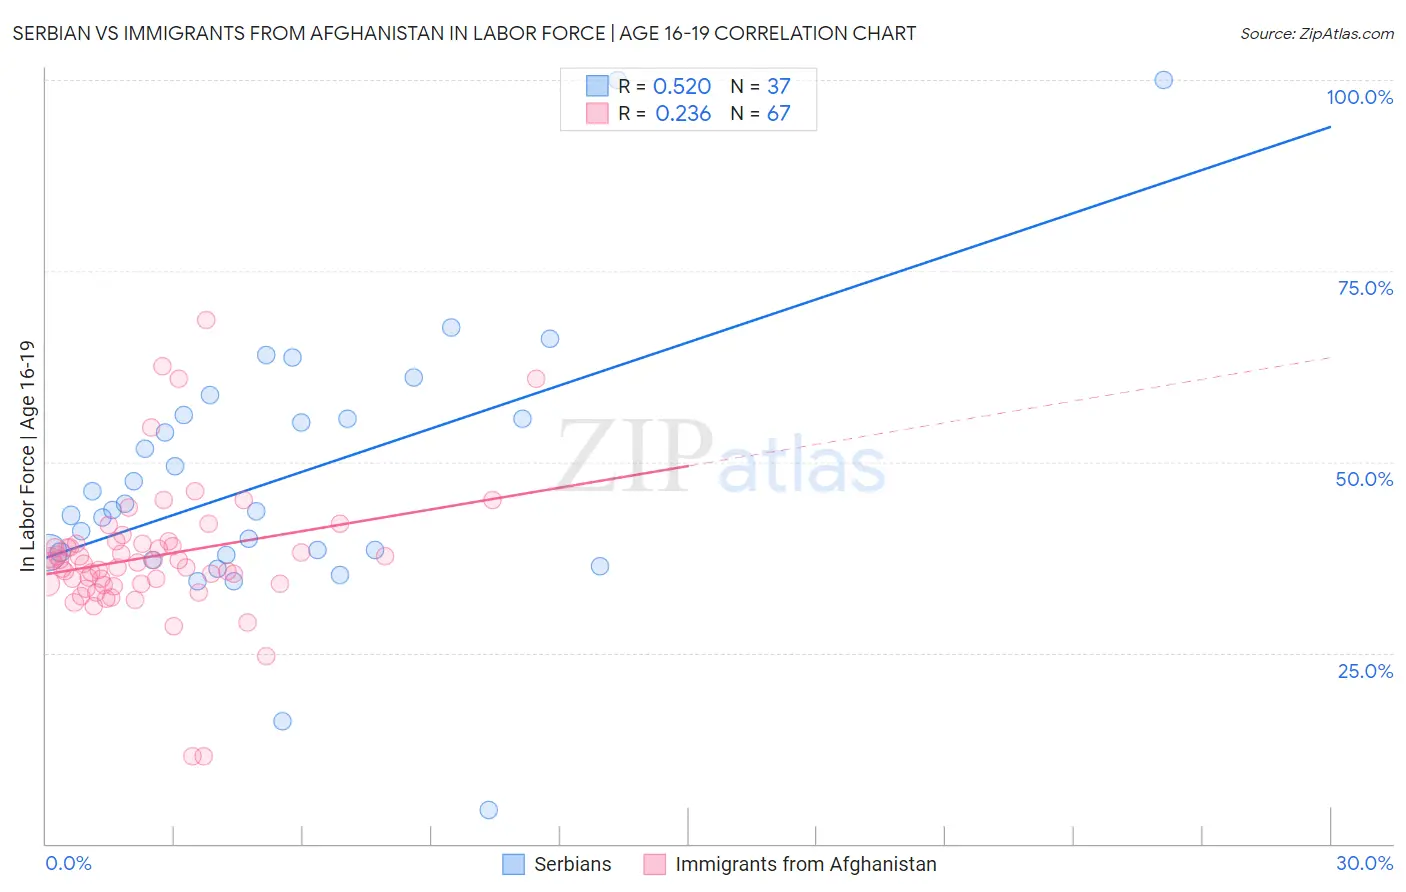
Serbian vs Immigrants from Afghanistan In Labor Force | Age 16-19 Correlation Chart
The statistical analysis conducted on geographies consisting of 267,337,384 people shows a substantial positive correlation between the proportion of Serbians and labor force participation rate among population between the ages 16 and 19 in the United States with a correlation coefficient (R) of 0.520 and weighted average of 39.9%. Similarly, the statistical analysis conducted on geographies consisting of 147,514,090 people shows a weak positive correlation between the proportion of Immigrants from Afghanistan and labor force participation rate among population between the ages 16 and 19 in the United States with a correlation coefficient (R) of 0.236 and weighted average of 36.3%, a difference of 10.2%.
In Labor Force | Age 16-19 Correlation Summary
| Measurement | Serbian | Immigrants from Afghanistan |
| Minimum | 4.4% | 11.4% |
| Maximum | 100.0% | 68.5% |
| Range | 95.6% | 57.1% |
| Mean | 48.0% | 37.7% |
| Median | 43.6% | 36.9% |
| Interquartile 25% (IQ1) | 37.9% | 34.0% |
| Interquartile 75% (IQ3) | 55.9% | 39.3% |
| Interquartile Range (IQR) | 18.0% | 5.3% |
| Standard Deviation (Sample) | 18.1% | 9.0% |
| Standard Deviation (Population) | 17.8% | 9.0% |
Similar Demographics by In Labor Force | Age 16-19
Demographics Similar to Serbians by In Labor Force | Age 16-19
In terms of in labor force | age 16-19, the demographic groups most similar to Serbians are Iroquois (39.9%, a difference of 0.010%), Immigrants from Middle Africa (39.9%, a difference of 0.040%), Portuguese (40.0%, a difference of 0.17%), Potawatomi (40.0%, a difference of 0.22%), and Hungarian (39.8%, a difference of 0.27%).
| Demographics | Rating | Rank | In Labor Force | Age 16-19 |
| Immigrants | Micronesia | 100.0 /100 | #64 | Exceptional 40.2% |
| Kenyans | 100.0 /100 | #65 | Exceptional 40.1% |
| Immigrants | Nonimmigrants | 100.0 /100 | #66 | Exceptional 40.1% |
| Canadians | 100.0 /100 | #67 | Exceptional 40.1% |
| Italians | 99.9 /100 | #68 | Exceptional 40.1% |
| Potawatomi | 99.9 /100 | #69 | Exceptional 40.0% |
| Portuguese | 99.9 /100 | #70 | Exceptional 40.0% |
| Serbians | 99.9 /100 | #71 | Exceptional 39.9% |
| Iroquois | 99.9 /100 | #72 | Exceptional 39.9% |
| Immigrants | Middle Africa | 99.9 /100 | #73 | Exceptional 39.9% |
| Hungarians | 99.9 /100 | #74 | Exceptional 39.8% |
| French American Indians | 99.9 /100 | #75 | Exceptional 39.8% |
| Malaysians | 99.9 /100 | #76 | Exceptional 39.7% |
| Immigrants | Portugal | 99.9 /100 | #77 | Exceptional 39.7% |
| Austrians | 99.8 /100 | #78 | Exceptional 39.5% |
Demographics Similar to Immigrants from Afghanistan by In Labor Force | Age 16-19
In terms of in labor force | age 16-19, the demographic groups most similar to Immigrants from Afghanistan are Immigrants from Romania (36.3%, a difference of 0.0%), Bhutanese (36.3%, a difference of 0.080%), Costa Rican (36.3%, a difference of 0.12%), Immigrants from Europe (36.2%, a difference of 0.13%), and Eastern European (36.4%, a difference of 0.27%).
| Demographics | Rating | Rank | In Labor Force | Age 16-19 |
| Immigrants | Morocco | 41.1 /100 | #180 | Average 36.4% |
| Jordanians | 39.6 /100 | #181 | Fair 36.4% |
| Immigrants | Italy | 39.1 /100 | #182 | Fair 36.4% |
| Eastern Europeans | 38.8 /100 | #183 | Fair 36.4% |
| Costa Ricans | 36.1 /100 | #184 | Fair 36.3% |
| Bhutanese | 35.3 /100 | #185 | Fair 36.3% |
| Immigrants | Romania | 34.0 /100 | #186 | Fair 36.3% |
| Immigrants | Afghanistan | 34.0 /100 | #187 | Fair 36.3% |
| Immigrants | Europe | 31.8 /100 | #188 | Fair 36.2% |
| Immigrants | Hungary | 28.8 /100 | #189 | Fair 36.2% |
| Panamanians | 28.6 /100 | #190 | Fair 36.1% |
| Immigrants | Croatia | 27.5 /100 | #191 | Fair 36.1% |
| Afghans | 25.7 /100 | #192 | Fair 36.1% |
| Immigrants | Denmark | 25.0 /100 | #193 | Fair 36.1% |
| Nigerians | 24.6 /100 | #194 | Fair 36.1% |