Belizean vs Welsh In Labor Force | Age 35-44
COMPARE
Belizean
Welsh
In Labor Force | Age 35-44
In Labor Force | Age 35-44 Comparison
Belizeans
Welsh
83.1%
IN LABOR FORCE | AGE 35-44
0.0/ 100
METRIC RATING
278th/ 347
METRIC RANK
84.0%
IN LABOR FORCE | AGE 35-44
5.3/ 100
METRIC RATING
228th/ 347
METRIC RANK
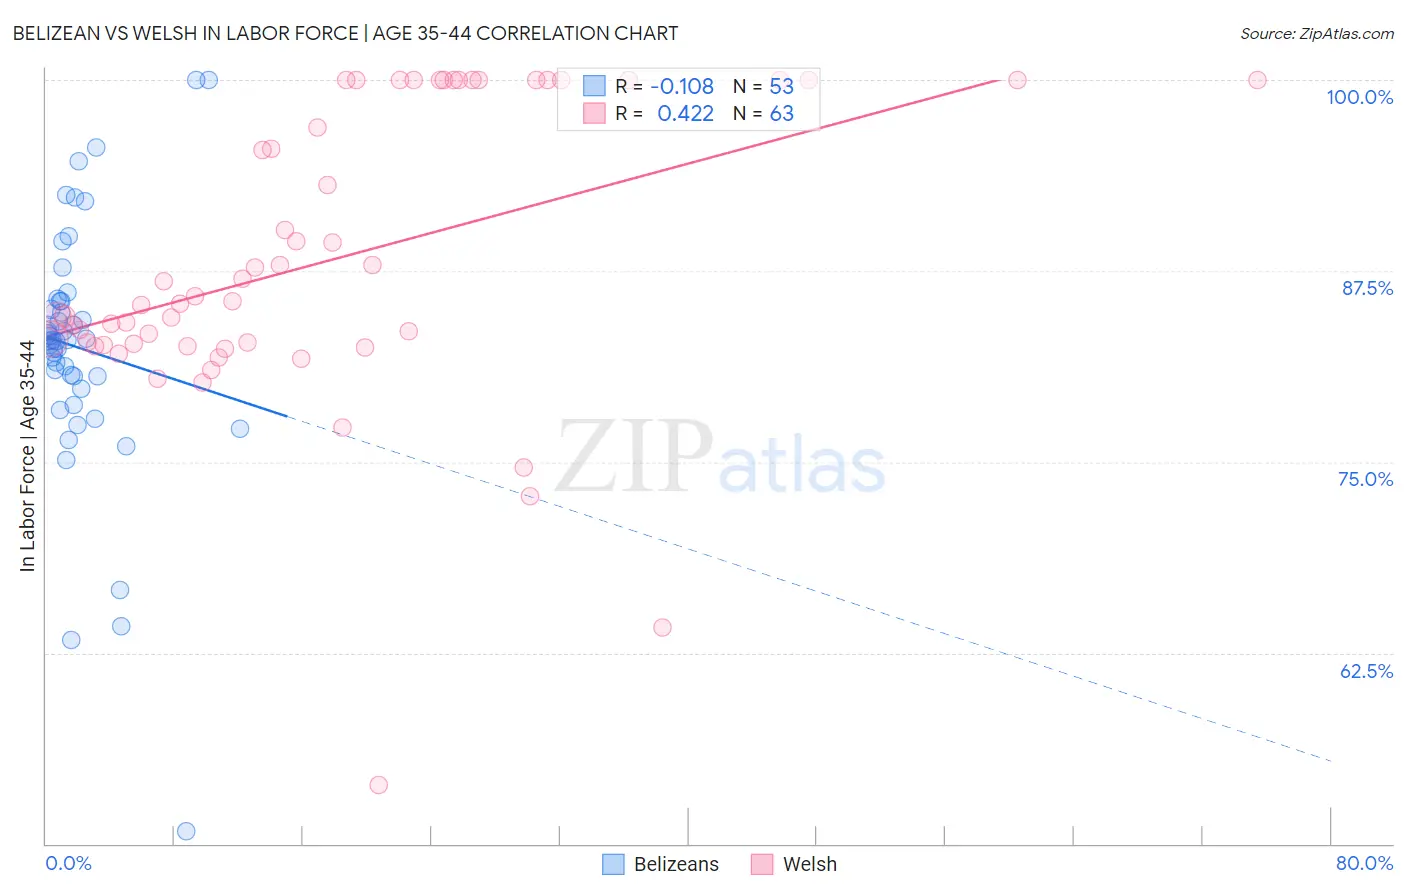
Belizean vs Welsh In Labor Force | Age 35-44 Correlation Chart
The statistical analysis conducted on geographies consisting of 144,190,758 people shows a poor negative correlation between the proportion of Belizeans and labor force participation rate among population between the ages 35 and 44 in the United States with a correlation coefficient (R) of -0.108 and weighted average of 83.1%. Similarly, the statistical analysis conducted on geographies consisting of 528,172,849 people shows a moderate positive correlation between the proportion of Welsh and labor force participation rate among population between the ages 35 and 44 in the United States with a correlation coefficient (R) of 0.422 and weighted average of 84.0%, a difference of 1.0%.
In Labor Force | Age 35-44 Correlation Summary
| Measurement | Belizean | Welsh |
| Minimum | 50.8% | 53.9% |
| Maximum | 100.0% | 100.0% |
| Range | 49.2% | 46.1% |
| Mean | 82.5% | 88.2% |
| Median | 83.0% | 85.5% |
| Interquartile 25% (IQ1) | 80.2% | 82.7% |
| Interquartile 75% (IQ3) | 85.5% | 100.0% |
| Interquartile Range (IQR) | 5.4% | 17.3% |
| Standard Deviation (Sample) | 8.4% | 9.7% |
| Standard Deviation (Population) | 8.3% | 9.6% |
Similar Demographics by In Labor Force | Age 35-44
Demographics Similar to Belizeans by In Labor Force | Age 35-44
In terms of in labor force | age 35-44, the demographic groups most similar to Belizeans are Immigrants from Micronesia (83.1%, a difference of 0.010%), Dominican (83.1%, a difference of 0.050%), Samoan (83.2%, a difference of 0.070%), Delaware (83.2%, a difference of 0.080%), and Hawaiian (83.2%, a difference of 0.090%).
| Demographics | Rating | Rank | In Labor Force | Age 35-44 |
| French American Indians | 0.0 /100 | #271 | Tragic 83.2% |
| Immigrants | Fiji | 0.0 /100 | #272 | Tragic 83.2% |
| Spanish | 0.0 /100 | #273 | Tragic 83.2% |
| Immigrants | Nonimmigrants | 0.0 /100 | #274 | Tragic 83.2% |
| Hawaiians | 0.0 /100 | #275 | Tragic 83.2% |
| Delaware | 0.0 /100 | #276 | Tragic 83.2% |
| Samoans | 0.0 /100 | #277 | Tragic 83.2% |
| Belizeans | 0.0 /100 | #278 | Tragic 83.1% |
| Immigrants | Micronesia | 0.0 /100 | #279 | Tragic 83.1% |
| Dominicans | 0.0 /100 | #280 | Tragic 83.1% |
| Guatemalans | 0.0 /100 | #281 | Tragic 83.0% |
| Osage | 0.0 /100 | #282 | Tragic 82.9% |
| Immigrants | Guatemala | 0.0 /100 | #283 | Tragic 82.9% |
| Immigrants | Dominican Republic | 0.0 /100 | #284 | Tragic 82.9% |
| Fijians | 0.0 /100 | #285 | Tragic 82.9% |
Demographics Similar to Welsh by In Labor Force | Age 35-44
In terms of in labor force | age 35-44, the demographic groups most similar to Welsh are Panamanian (84.0%, a difference of 0.0%), British West Indian (84.0%, a difference of 0.0%), U.S. Virgin Islander (84.0%, a difference of 0.020%), Immigrants from Burma/Myanmar (84.0%, a difference of 0.020%), and Immigrants from Thailand (84.0%, a difference of 0.020%).
| Demographics | Rating | Rank | In Labor Force | Age 35-44 |
| Icelanders | 6.7 /100 | #221 | Tragic 84.0% |
| Assyrians/Chaldeans/Syriacs | 6.6 /100 | #222 | Tragic 84.0% |
| Immigrants | Panama | 6.4 /100 | #223 | Tragic 84.0% |
| U.S. Virgin Islanders | 6.1 /100 | #224 | Tragic 84.0% |
| Immigrants | Burma/Myanmar | 6.1 /100 | #225 | Tragic 84.0% |
| Panamanians | 5.4 /100 | #226 | Tragic 84.0% |
| British West Indians | 5.3 /100 | #227 | Tragic 84.0% |
| Welsh | 5.3 /100 | #228 | Tragic 84.0% |
| Immigrants | Thailand | 4.7 /100 | #229 | Tragic 84.0% |
| Immigrants | Iraq | 3.7 /100 | #230 | Tragic 83.9% |
| Scottish | 3.2 /100 | #231 | Tragic 83.9% |
| Native Hawaiians | 3.0 /100 | #232 | Tragic 83.9% |
| Immigrants | Germany | 2.8 /100 | #233 | Tragic 83.9% |
| Immigrants | Oceania | 2.6 /100 | #234 | Tragic 83.9% |
| Immigrants | Syria | 2.5 /100 | #235 | Tragic 83.9% |