Immigrants from Afghanistan vs Welsh In Labor Force | Age 35-44
COMPARE
Immigrants from Afghanistan
Welsh
In Labor Force | Age 35-44
In Labor Force | Age 35-44 Comparison
Immigrants from Afghanistan
Welsh
84.4%
IN LABOR FORCE | AGE 35-44
52.7/ 100
METRIC RATING
169th/ 347
METRIC RANK
84.0%
IN LABOR FORCE | AGE 35-44
5.3/ 100
METRIC RATING
228th/ 347
METRIC RANK
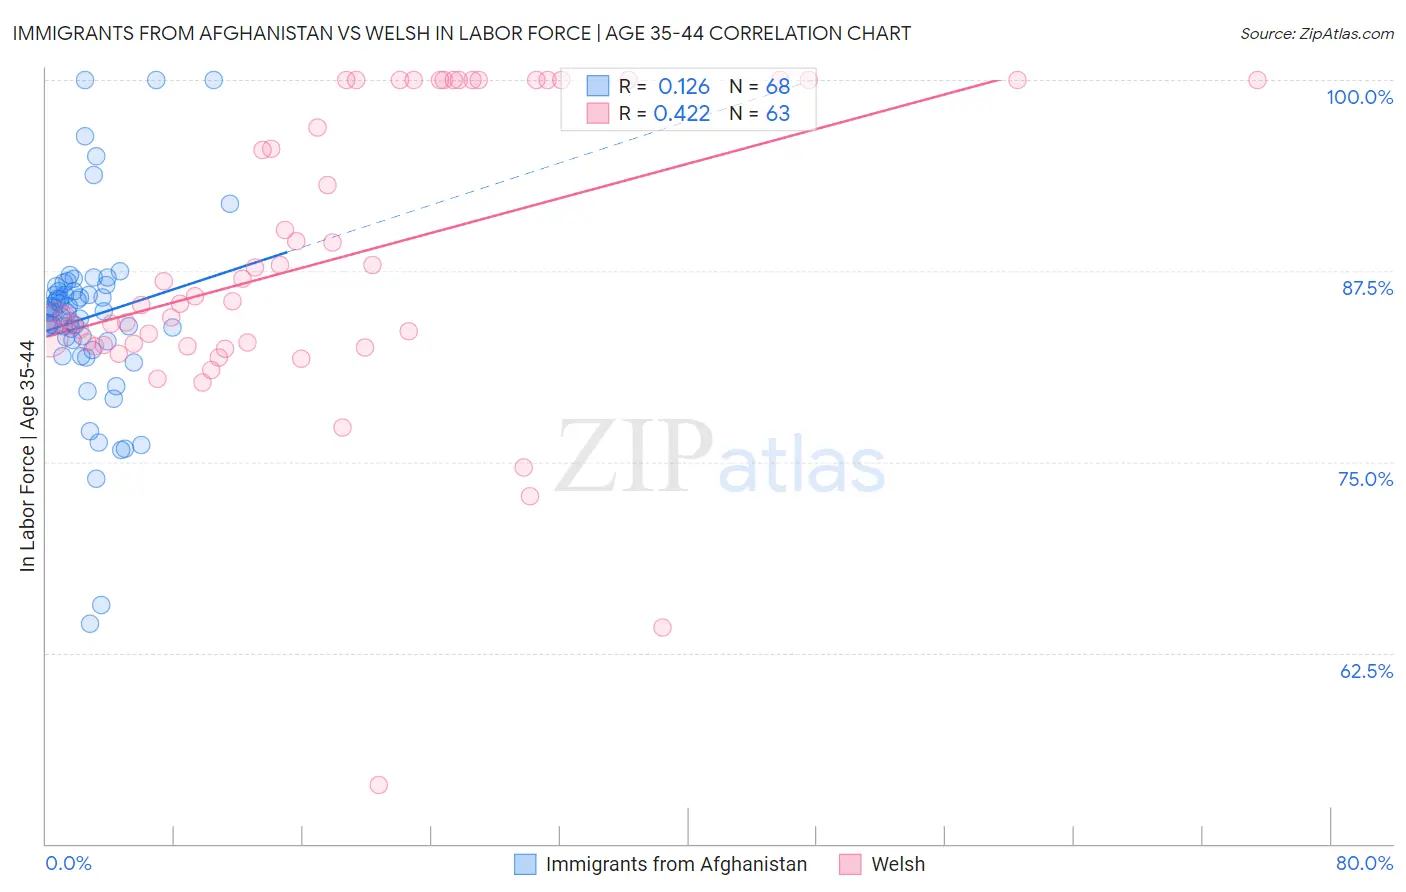
Immigrants from Afghanistan vs Welsh In Labor Force | Age 35-44 Correlation Chart
The statistical analysis conducted on geographies consisting of 147,638,849 people shows a poor positive correlation between the proportion of Immigrants from Afghanistan and labor force participation rate among population between the ages 35 and 44 in the United States with a correlation coefficient (R) of 0.126 and weighted average of 84.4%. Similarly, the statistical analysis conducted on geographies consisting of 528,172,849 people shows a moderate positive correlation between the proportion of Welsh and labor force participation rate among population between the ages 35 and 44 in the United States with a correlation coefficient (R) of 0.422 and weighted average of 84.0%, a difference of 0.49%.
In Labor Force | Age 35-44 Correlation Summary
| Measurement | Immigrants from Afghanistan | Welsh |
| Minimum | 64.4% | 53.9% |
| Maximum | 100.0% | 100.0% |
| Range | 35.6% | 46.1% |
| Mean | 84.4% | 88.2% |
| Median | 84.8% | 85.5% |
| Interquartile 25% (IQ1) | 82.9% | 82.7% |
| Interquartile 75% (IQ3) | 86.2% | 100.0% |
| Interquartile Range (IQR) | 3.3% | 17.3% |
| Standard Deviation (Sample) | 6.1% | 9.7% |
| Standard Deviation (Population) | 6.1% | 9.6% |
Similar Demographics by In Labor Force | Age 35-44
Demographics Similar to Immigrants from Afghanistan by In Labor Force | Age 35-44
In terms of in labor force | age 35-44, the demographic groups most similar to Immigrants from Afghanistan are Irish (84.4%, a difference of 0.0%), Immigrants from Jordan (84.4%, a difference of 0.0%), Jordanian (84.4%, a difference of 0.010%), Scandinavian (84.4%, a difference of 0.010%), and Immigrants from Trinidad and Tobago (84.4%, a difference of 0.010%).
| Demographics | Rating | Rank | In Labor Force | Age 35-44 |
| Immigrants | Hungary | 59.4 /100 | #162 | Average 84.4% |
| Aleuts | 59.1 /100 | #163 | Average 84.4% |
| Nigerians | 58.9 /100 | #164 | Average 84.4% |
| Venezuelans | 58.1 /100 | #165 | Average 84.4% |
| Alsatians | 55.2 /100 | #166 | Average 84.4% |
| Immigrants | Portugal | 55.2 /100 | #167 | Average 84.4% |
| Irish | 53.1 /100 | #168 | Average 84.4% |
| Immigrants | Afghanistan | 52.7 /100 | #169 | Average 84.4% |
| Immigrants | Jordan | 52.5 /100 | #170 | Average 84.4% |
| Jordanians | 51.7 /100 | #171 | Average 84.4% |
| Scandinavians | 51.2 /100 | #172 | Average 84.4% |
| Immigrants | Trinidad and Tobago | 50.7 /100 | #173 | Average 84.4% |
| Immigrants | Iran | 50.0 /100 | #174 | Average 84.4% |
| Pakistanis | 48.2 /100 | #175 | Average 84.4% |
| Sri Lankans | 47.3 /100 | #176 | Average 84.4% |
Demographics Similar to Welsh by In Labor Force | Age 35-44
In terms of in labor force | age 35-44, the demographic groups most similar to Welsh are Panamanian (84.0%, a difference of 0.0%), British West Indian (84.0%, a difference of 0.0%), U.S. Virgin Islander (84.0%, a difference of 0.020%), Immigrants from Burma/Myanmar (84.0%, a difference of 0.020%), and Immigrants from Thailand (84.0%, a difference of 0.020%).
| Demographics | Rating | Rank | In Labor Force | Age 35-44 |
| Icelanders | 6.7 /100 | #221 | Tragic 84.0% |
| Assyrians/Chaldeans/Syriacs | 6.6 /100 | #222 | Tragic 84.0% |
| Immigrants | Panama | 6.4 /100 | #223 | Tragic 84.0% |
| U.S. Virgin Islanders | 6.1 /100 | #224 | Tragic 84.0% |
| Immigrants | Burma/Myanmar | 6.1 /100 | #225 | Tragic 84.0% |
| Panamanians | 5.4 /100 | #226 | Tragic 84.0% |
| British West Indians | 5.3 /100 | #227 | Tragic 84.0% |
| Welsh | 5.3 /100 | #228 | Tragic 84.0% |
| Immigrants | Thailand | 4.7 /100 | #229 | Tragic 84.0% |
| Immigrants | Iraq | 3.7 /100 | #230 | Tragic 83.9% |
| Scottish | 3.2 /100 | #231 | Tragic 83.9% |
| Native Hawaiians | 3.0 /100 | #232 | Tragic 83.9% |
| Immigrants | Germany | 2.8 /100 | #233 | Tragic 83.9% |
| Immigrants | Oceania | 2.6 /100 | #234 | Tragic 83.9% |
| Immigrants | Syria | 2.5 /100 | #235 | Tragic 83.9% |