Northern European vs African In Labor Force | Age 25-29

COMPARE

Northern European
Race
Ancestry
AfghanAlaska NativeAlaskan AthabascanAlbanianAleutAlsatianAmericanApacheArabArapahoArgentineanArmenianAssyrian/Chaldean/SyriacAustralianAustrianBahamianBangladeshiBarbadianBasqueBelgianBelizeanBermudanBhutaneseBlackfeetBolivianBrazilianBritishBritish West IndianBulgarianBurmeseCajunCambodianCanadianCape VerdeanCarpatho RusynCelticCentral AmericanCentral American IndianCherokeeCheyenneChickasawChileanChineseChippewaChoctawColombianColvilleComancheCosta RicanCreeCreekCroatianCrowCubanCypriotCzechCzechoslovakianDanishDelawareDominicanDutchDutch West IndianEastern EuropeanEcuadorianEgyptianEnglishEstonianEthiopianEuropeanFijianFilipinoFinnishFrenchFrench American IndianFrench CanadianGermanGerman RussianGhanaianGreekGuamanian/ChamorroGuatemalanGuyaneseHaitianHmongHonduranHopiHoumaHungarianIcelanderIndian (Asian)IndonesianInupiatIranianIraqiIrishIroquoisIsraeliItalianJamaicanJapaneseJordanianKenyanKiowaKoreanLaotianLatvianLebaneseLiberianLithuanianLumbeeLuxembourgerMacedonianMalaysianMalteseMarshalleseMenomineeMexicanMexican American IndianMongolianMoroccanNative HawaiianNavajoNepaleseNew ZealanderNicaraguanNigerianNorthern EuropeanNorwegianOkinawanOsageOttawaPaiutePakistaniPalestinianPanamanianParaguayanPennsylvania GermanPeruvianPimaPolishPortuguesePotawatomiPuebloPuerto RicanPuget Sound SalishRomanianRussianSalvadoranSamoanScandinavianScotch-IrishScottishSeminoleSenegaleseSerbianShoshoneSierra LeoneanSiouxSlavicSlovakSloveneSomaliSouth AfricanSouth AmericanSouth American IndianSoviet UnionSpaniardSpanishSpanish AmericanSpanish American IndianSri LankanSubsaharan AfricanSudaneseSwedishSwissSyrianTaiwaneseThaiTlingit-HaidaTohono O'OdhamTonganTrinidadian and TobagonianTsimshianTurkishU.S. Virgin IslanderUgandanUkrainianUruguayanUteVenezuelanVietnameseWelshWest IndianYakamaYaquiYugoslavianYumanYup'ikZimbabwean
Immigration
NonimmigrantsImmigrantsAfghanistanAfricaAlbaniaArgentinaArmeniaAsiaAustraliaAustriaBahamasBangladeshBarbadosBelarusBelgiumBelizeBoliviaBosnia and HerzegovinaBrazilBulgariaBurma/MyanmarCabo VerdeCambodiaCameroonCanadaCaribbeanCentral AmericaChileChinaColombiaCongoCosta RicaCroatiaCubaCzechoslovakiaDenmarkDominicaDominican RepublicEastern AfricaEastern AsiaEastern EuropeEcuadorEgyptEl SalvadorEnglandEritreaEthiopiaEuropeFijiFranceGermanyGhanaGreeceGrenadaGuatemalaGuyanaHaitiHondurasHong KongHungaryIndiaIndonesiaIranIraqIrelandIsraelItalyJamaicaJapanJordanKazakhstanKenyaKoreaKuwaitLaosLatin AmericaLatviaLebanonLiberiaLithuaniaMalaysiaMexicoMicronesiaMiddle AfricaMoldovaMoroccoNepalNetherlandsNicaraguaNigeriaNorth AmericaNorth MacedoniaNorthern AfricaNorthern EuropeNorwayOceaniaPakistanPanamaPeruPhilippinesPolandPortugalRomaniaRussiaSaudi ArabiaScotlandSenegalSerbiaSierra LeoneSingaporeSomaliaSouth AfricaSouth AmericaSouth Central AsiaSouth Eastern AsiaSouthern EuropeSpainSri LankaSt. Vincent and the GrenadinesSudanSwedenSwitzerlandSyriaTaiwanThailandTrinidad and TobagoTurkeyUgandaUkraineUruguayUzbekistanVenezuelaVietnamWest IndiesWestern AfricaWestern AsiaWestern EuropeYemenZaireZimbabweAzores
African
Race
Ancestry
AfghanAfricanAlaska NativeAlaskan AthabascanAlbanianAleutAlsatianAmericanApacheArabArapahoArgentineanArmenianAssyrian/Chaldean/SyriacAustralianAustrianBahamianBangladeshiBarbadianBasqueBelgianBelizeanBermudanBhutaneseBlackfeetBolivianBrazilianBritishBritish West IndianBulgarianBurmeseCajunCambodianCanadianCape VerdeanCarpatho RusynCelticCentral AmericanCentral American IndianCherokeeCheyenneChickasawChileanChineseChippewaChoctawColombianColvilleComancheCosta RicanCreeCreekCroatianCrowCubanCypriotCzechCzechoslovakianDanishDelawareDominicanDutchDutch West IndianEastern EuropeanEcuadorianEgyptianEnglishEstonianEthiopianEuropeanFijianFilipinoFinnishFrenchFrench American IndianFrench CanadianGermanGerman RussianGhanaianGreekGuamanian/ChamorroGuatemalanGuyaneseHaitianHmongHonduranHopiHoumaHungarianIcelanderIndian (Asian)IndonesianInupiatIranianIraqiIrishIroquoisIsraeliItalianJamaicanJapaneseJordanianKenyanKiowaKoreanLaotianLatvianLebaneseLiberianLithuanianLumbeeLuxembourgerMacedonianMalaysianMalteseMarshalleseMenomineeMexicanMexican American IndianMongolianMoroccanNative HawaiianNavajoNepaleseNew ZealanderNicaraguanNigerianNorwegianOkinawanOsageOttawaPaiutePakistaniPalestinianPanamanianParaguayanPennsylvania GermanPeruvianPimaPolishPortuguesePotawatomiPuebloPuerto RicanPuget Sound SalishRomanianRussianSalvadoranSamoanScandinavianScotch-IrishScottishSeminoleSenegaleseSerbianShoshoneSierra LeoneanSiouxSlavicSlovakSloveneSomaliSouth AfricanSouth AmericanSouth American IndianSoviet UnionSpaniardSpanishSpanish AmericanSpanish American IndianSri LankanSubsaharan AfricanSudaneseSwedishSwissSyrianTaiwaneseThaiTlingit-HaidaTohono O'OdhamTonganTrinidadian and TobagonianTsimshianTurkishU.S. Virgin IslanderUgandanUkrainianUruguayanUteVenezuelanVietnameseWelshWest IndianYakamaYaquiYugoslavianYumanYup'ikZimbabwean
Immigration
NonimmigrantsImmigrantsAfghanistanAfricaAlbaniaArgentinaArmeniaAsiaAustraliaAustriaBahamasBangladeshBarbadosBelarusBelgiumBelizeBoliviaBosnia and HerzegovinaBrazilBulgariaBurma/MyanmarCabo VerdeCambodiaCameroonCanadaCaribbeanCentral AmericaChileChinaColombiaCongoCosta RicaCroatiaCubaCzechoslovakiaDenmarkDominicaDominican RepublicEastern AfricaEastern AsiaEastern EuropeEcuadorEgyptEl SalvadorEnglandEritreaEthiopiaEuropeFijiFranceGermanyGhanaGreeceGrenadaGuatemalaGuyanaHaitiHondurasHong KongHungaryIndiaIndonesiaIranIraqIrelandIsraelItalyJamaicaJapanJordanKazakhstanKenyaKoreaKuwaitLaosLatin AmericaLatviaLebanonLiberiaLithuaniaMalaysiaMexicoMicronesiaMiddle AfricaMoldovaMoroccoNepalNetherlandsNicaraguaNigeriaNorth AmericaNorth MacedoniaNorthern AfricaNorthern EuropeNorwayOceaniaPakistanPanamaPeruPhilippinesPolandPortugalRomaniaRussiaSaudi ArabiaScotlandSenegalSerbiaSierra LeoneSingaporeSomaliaSouth AfricaSouth AmericaSouth Central AsiaSouth Eastern AsiaSouthern EuropeSpainSri LankaSt. Vincent and the GrenadinesSudanSwedenSwitzerlandSyriaTaiwanThailandTrinidad and TobagoTurkeyUgandaUkraineUruguayUzbekistanVenezuelaVietnamWest IndiesWestern AfricaWestern AsiaWestern EuropeYemenZaireZimbabweAzores
In Labor Force | Age 25-29
Income
Poverty
Unemployment
Labor Participation
Family Structure
Vehicle Availability
Education Level
Disability

In Labor Force | Age 25-29 Comparison

Northern Europeans

Africans

Excellent
Tragic
84.9%
IN LABOR FORCE | AGE 25-29
81.3/ 100
METRIC RATING
130th/ 347
METRIC RANK
83.2%
IN LABOR FORCE | AGE 25-29
0.0/ 100
METRIC RATING
277th/ 347
METRIC RANK

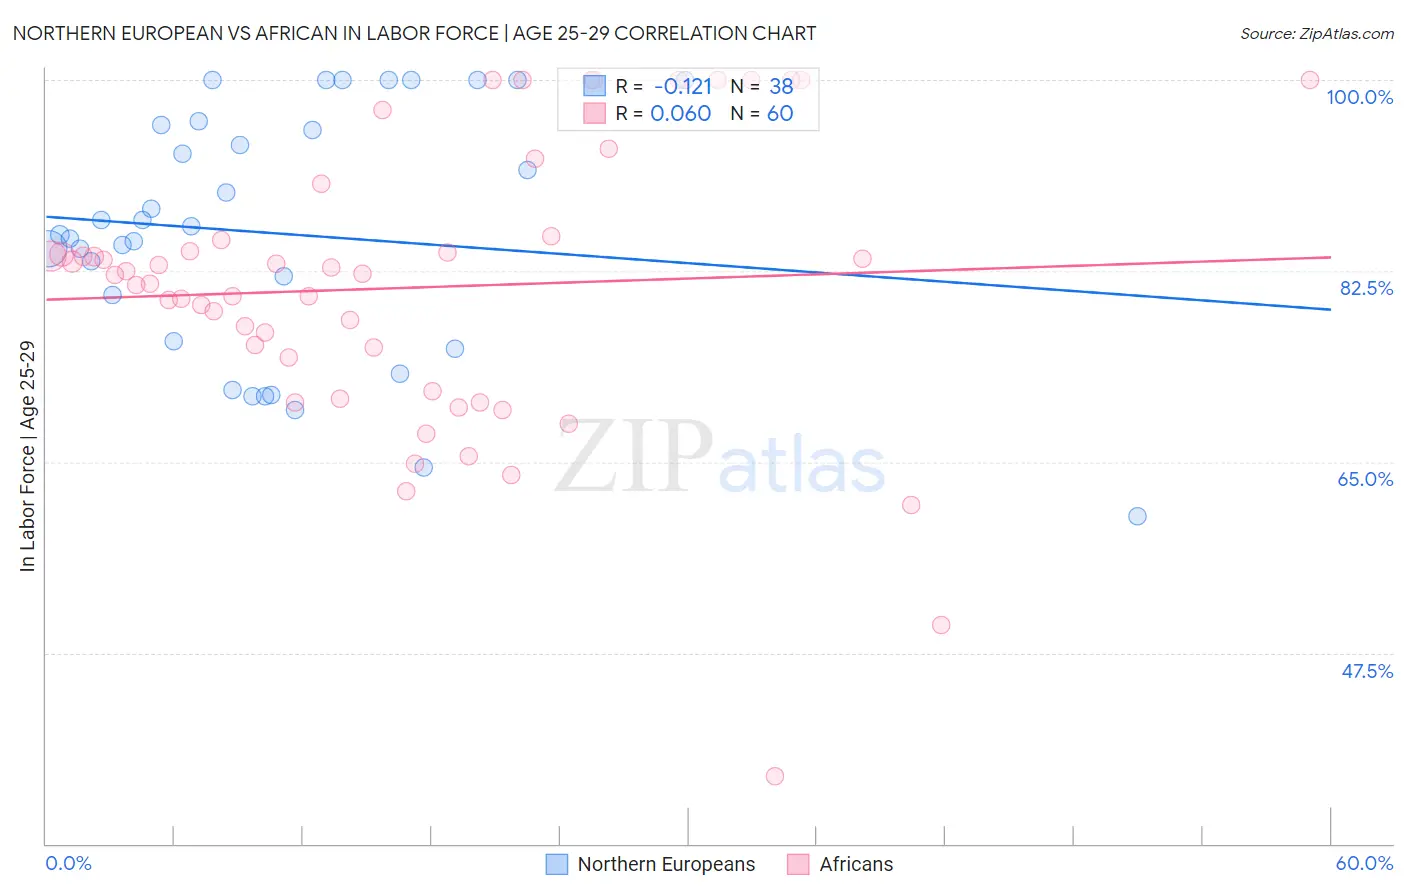
Northern European vs African In Labor Force | Age 25-29 Correlation Chart

The statistical analysis conducted on geographies consisting of 405,845,556 people shows a poor negative correlation between the proportion of Northern Europeans and labor force participation rate among population between the ages 25 and 29 in the United States with a correlation coefficient (R) of -0.121 and weighted average of 84.9%. Similarly, the statistical analysis conducted on geographies consisting of 469,793,386 people shows a slight positive correlation between the proportion of Africans and labor force participation rate among population between the ages 25 and 29 in the United States with a correlation coefficient (R) of 0.060 and weighted average of 83.2%, a difference of 2.0%.
Northern European vs African In Labor Force | Age 25-29

In Labor Force | Age 25-29 Correlation Summary

MeasurementNorthern EuropeanAfrican
Minimum60.0%36.2%
Maximum100.0%100.0%
Range40.0%63.8%
Mean85.9%81.0%
Median86.2%82.2%
Interquartile 25% (IQ1)76.1%73.0%
Interquartile 75% (IQ3)95.9%85.5%
Interquartile Range (IQR)19.8%12.5%
Standard Deviation (Sample)11.3%13.1%
Standard Deviation (Population)11.2%12.9%

Similar Demographics by In Labor Force | Age 25-29

Demographics Similar to Northern Europeans by In Labor Force | Age 25-29

In terms of in labor force | age 25-29, the demographic groups most similar to Northern Europeans are Immigrants from Russia (84.9%, a difference of 0.0%), Immigrants from Uruguay (84.9%, a difference of 0.030%), Australian (84.9%, a difference of 0.030%), Uruguayan (84.9%, a difference of 0.040%), and Immigrants from Singapore (84.9%, a difference of 0.040%).
DemographicsRating | RankIn Labor Force | Age 25-29
Dutch
84.9
/100
|
#123
Excellent
84.9%
Immigrants | Iran
84.8
/100
|
#124
Excellent
84.9%
Uruguayans
84.7
/100
|
#125
Excellent
84.9%
Immigrants | Singapore
84.4
/100
|
#126
Excellent
84.9%
Immigrants | Uruguay
84.0
/100
|
#127
Excellent
84.9%
Australians
83.6
/100
|
#128
Excellent
84.9%
Immigrants | Russia
81.6
/100
|
#129
Excellent
84.9%
Northern Europeans
81.3
/100
|
#130
Excellent
84.9%
Iranians
78.1
/100
|
#131
Good
84.8%
Romanians
77.7
/100
|
#132
Good
84.8%
Asians
77.7
/100
|
#133
Good
84.8%
Syrians
76.5
/100
|
#134
Good
84.8%
Immigrants | Hungary
76.4
/100
|
#135
Good
84.8%
Bhutanese
76.0
/100
|
#136
Good
84.8%
Immigrants | Canada
73.5
/100
|
#137
Good
84.8%

Demographics Similar to Africans by In Labor Force | Age 25-29

In terms of in labor force | age 25-29, the demographic groups most similar to Africans are Immigrants from Cuba (83.2%, a difference of 0.050%), British West Indian (83.2%, a difference of 0.060%), Samoan (83.3%, a difference of 0.070%), Immigrants from Honduras (83.3%, a difference of 0.070%), and Dominican (83.2%, a difference of 0.080%).
DemographicsRating | RankIn Labor Force | Age 25-29
Basques
0.0
/100
|
#270
Tragic
83.4%
Hondurans
0.0
/100
|
#271
Tragic
83.4%
Immigrants | Caribbean
0.0
/100
|
#272
Tragic
83.4%
Immigrants | Dominica
0.0
/100
|
#273
Tragic
83.4%
Marshallese
0.0
/100
|
#274
Tragic
83.3%
Samoans
0.0
/100
|
#275
Tragic
83.3%
Immigrants | Honduras
0.0
/100
|
#276
Tragic
83.3%
Africans
0.0
/100
|
#277
Tragic
83.2%
Immigrants | Cuba
0.0
/100
|
#278
Tragic
83.2%
British West Indians
0.0
/100
|
#279
Tragic
83.2%
Dominicans
0.0
/100
|
#280
Tragic
83.2%
Immigrants | Dominican Republic
0.0
/100
|
#281
Tragic
83.1%
Americans
0.0
/100
|
#282
Tragic
83.1%
Immigrants | Azores
0.0
/100
|
#283
Tragic
83.1%
Nicaraguans
0.0
/100
|
#284
Tragic
83.1%