Immigrants from Africa vs African In Labor Force | Age 25-29
COMPARE
Immigrants from Africa
African
In Labor Force | Age 25-29
In Labor Force | Age 25-29 Comparison
Immigrants from Africa
Africans
85.2%
IN LABOR FORCE | AGE 25-29
96.7/ 100
METRIC RATING
85th/ 347
METRIC RANK
83.2%
IN LABOR FORCE | AGE 25-29
0.0/ 100
METRIC RATING
277th/ 347
METRIC RANK
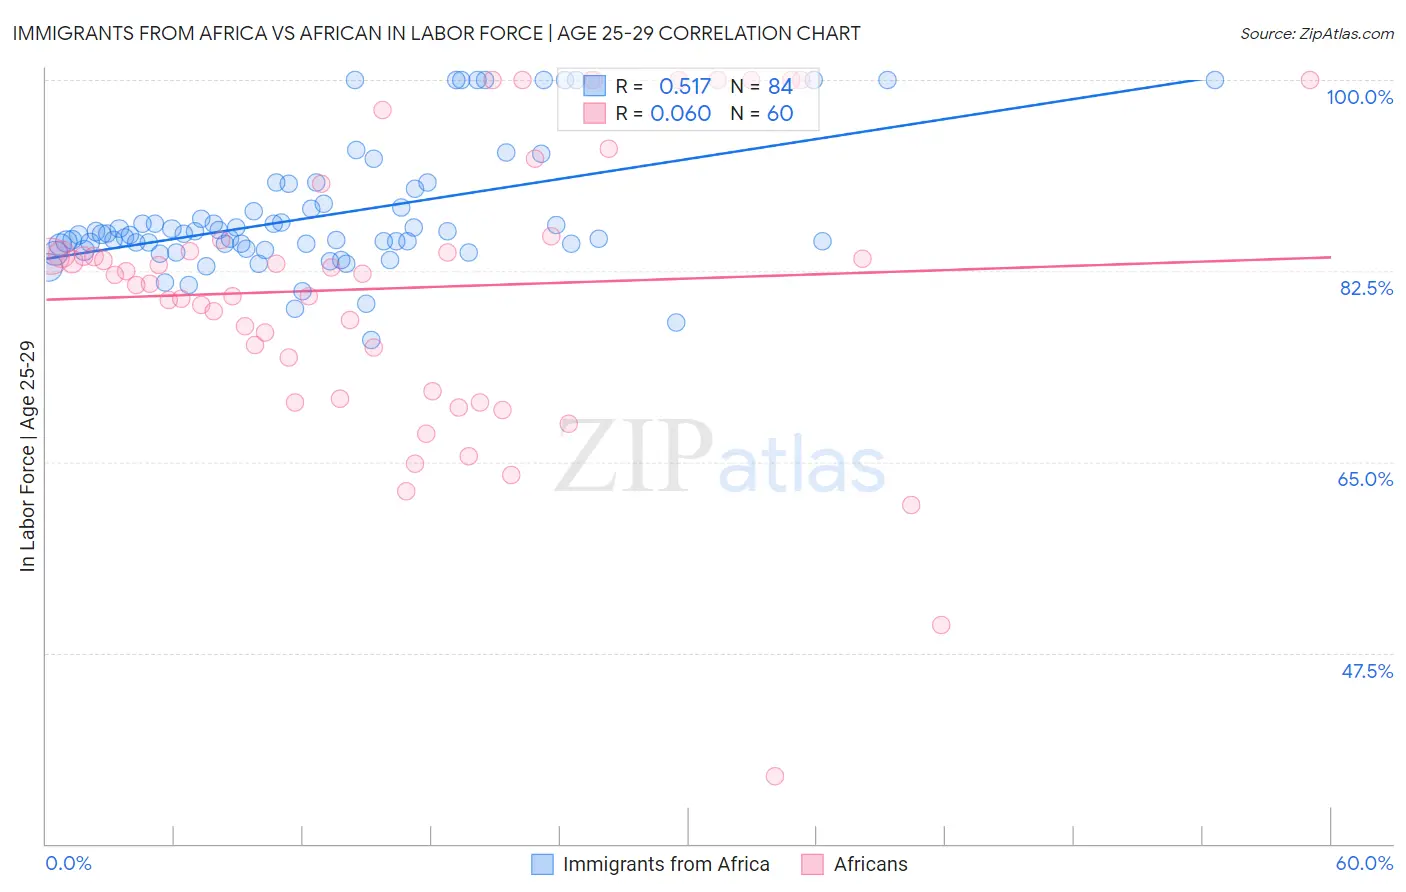
Immigrants from Africa vs African In Labor Force | Age 25-29 Correlation Chart
The statistical analysis conducted on geographies consisting of 469,196,939 people shows a substantial positive correlation between the proportion of Immigrants from Africa and labor force participation rate among population between the ages 25 and 29 in the United States with a correlation coefficient (R) of 0.517 and weighted average of 85.2%. Similarly, the statistical analysis conducted on geographies consisting of 469,793,386 people shows a slight positive correlation between the proportion of Africans and labor force participation rate among population between the ages 25 and 29 in the United States with a correlation coefficient (R) of 0.060 and weighted average of 83.2%, a difference of 2.3%.
In Labor Force | Age 25-29 Correlation Summary
| Measurement | Immigrants from Africa | African |
| Minimum | 76.2% | 36.2% |
| Maximum | 100.0% | 100.0% |
| Range | 23.8% | 63.8% |
| Mean | 87.5% | 81.0% |
| Median | 85.8% | 82.2% |
| Interquartile 25% (IQ1) | 84.7% | 73.0% |
| Interquartile 75% (IQ3) | 88.5% | 85.5% |
| Interquartile Range (IQR) | 3.8% | 12.5% |
| Standard Deviation (Sample) | 5.7% | 13.1% |
| Standard Deviation (Population) | 5.7% | 12.9% |
Similar Demographics by In Labor Force | Age 25-29
Demographics Similar to Immigrants from Africa by In Labor Force | Age 25-29
In terms of in labor force | age 25-29, the demographic groups most similar to Immigrants from Africa are Immigrants from Eastern Europe (85.2%, a difference of 0.0%), Ukrainian (85.2%, a difference of 0.0%), Okinawan (85.2%, a difference of 0.010%), Immigrants from Europe (85.2%, a difference of 0.010%), and French Canadian (85.2%, a difference of 0.010%).
| Demographics | Rating | Rank | In Labor Force | Age 25-29 |
| Immigrants | Egypt | 97.7 /100 | #78 | Exceptional 85.2% |
| Immigrants | Northern Africa | 97.6 /100 | #79 | Exceptional 85.2% |
| Immigrants | Zimbabwe | 97.6 /100 | #80 | Exceptional 85.2% |
| Immigrants | Northern Europe | 97.2 /100 | #81 | Exceptional 85.2% |
| Okinawans | 97.0 /100 | #82 | Exceptional 85.2% |
| Immigrants | Europe | 96.8 /100 | #83 | Exceptional 85.2% |
| Immigrants | Eastern Europe | 96.8 /100 | #84 | Exceptional 85.2% |
| Immigrants | Africa | 96.7 /100 | #85 | Exceptional 85.2% |
| Ukrainians | 96.7 /100 | #86 | Exceptional 85.2% |
| French Canadians | 96.5 /100 | #87 | Exceptional 85.2% |
| Immigrants | Croatia | 96.4 /100 | #88 | Exceptional 85.2% |
| Immigrants | France | 96.3 /100 | #89 | Exceptional 85.2% |
| Burmese | 95.9 /100 | #90 | Exceptional 85.1% |
| Immigrants | Moldova | 95.8 /100 | #91 | Exceptional 85.1% |
| Immigrants | Costa Rica | 95.5 /100 | #92 | Exceptional 85.1% |
Demographics Similar to Africans by In Labor Force | Age 25-29
In terms of in labor force | age 25-29, the demographic groups most similar to Africans are Immigrants from Cuba (83.2%, a difference of 0.050%), British West Indian (83.2%, a difference of 0.060%), Samoan (83.3%, a difference of 0.070%), Immigrants from Honduras (83.3%, a difference of 0.070%), and Dominican (83.2%, a difference of 0.080%).
| Demographics | Rating | Rank | In Labor Force | Age 25-29 |
| Basques | 0.0 /100 | #270 | Tragic 83.4% |
| Hondurans | 0.0 /100 | #271 | Tragic 83.4% |
| Immigrants | Caribbean | 0.0 /100 | #272 | Tragic 83.4% |
| Immigrants | Dominica | 0.0 /100 | #273 | Tragic 83.4% |
| Marshallese | 0.0 /100 | #274 | Tragic 83.3% |
| Samoans | 0.0 /100 | #275 | Tragic 83.3% |
| Immigrants | Honduras | 0.0 /100 | #276 | Tragic 83.3% |
| Africans | 0.0 /100 | #277 | Tragic 83.2% |
| Immigrants | Cuba | 0.0 /100 | #278 | Tragic 83.2% |
| British West Indians | 0.0 /100 | #279 | Tragic 83.2% |
| Dominicans | 0.0 /100 | #280 | Tragic 83.2% |
| Immigrants | Dominican Republic | 0.0 /100 | #281 | Tragic 83.1% |
| Americans | 0.0 /100 | #282 | Tragic 83.1% |
| Immigrants | Azores | 0.0 /100 | #283 | Tragic 83.1% |
| Nicaraguans | 0.0 /100 | #284 | Tragic 83.1% |