Hawaiian vs Immigrants from Dominican Republic In Labor Force | Age 16-19
COMPARE
Hawaiian
Immigrants from Dominican Republic
In Labor Force | Age 16-19
In Labor Force | Age 16-19 Comparison
Hawaiians
Immigrants from Dominican Republic
38.4%
IN LABOR FORCE | AGE 16-19
98.2/ 100
METRIC RATING
114th/ 347
METRIC RANK
31.1%
IN LABOR FORCE | AGE 16-19
0.0/ 100
METRIC RATING
326th/ 347
METRIC RANK
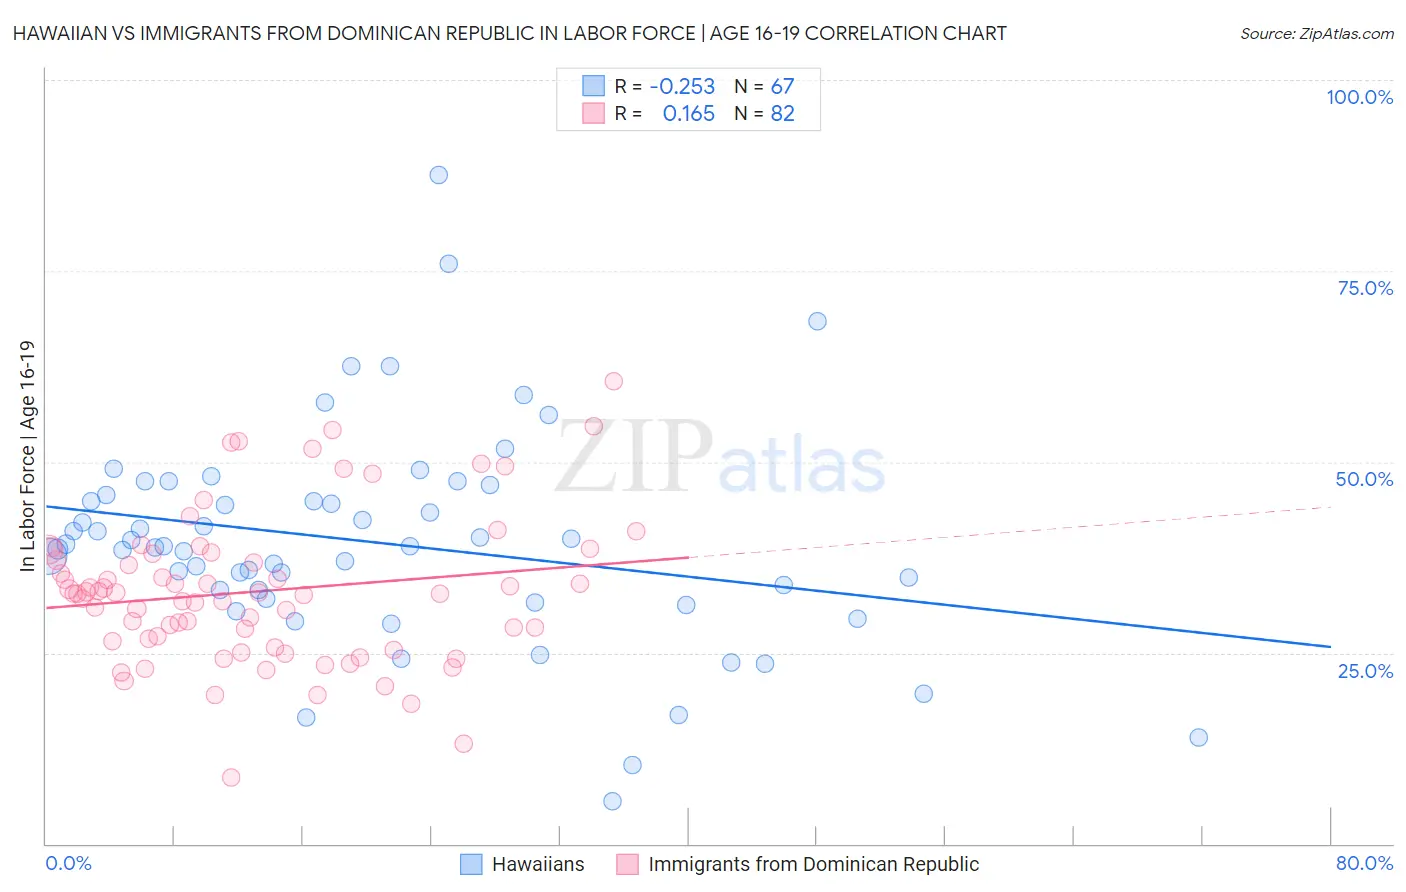
Hawaiian vs Immigrants from Dominican Republic In Labor Force | Age 16-19 Correlation Chart
The statistical analysis conducted on geographies consisting of 327,147,423 people shows a weak negative correlation between the proportion of Hawaiians and labor force participation rate among population between the ages 16 and 19 in the United States with a correlation coefficient (R) of -0.253 and weighted average of 38.4%. Similarly, the statistical analysis conducted on geographies consisting of 274,798,225 people shows a poor positive correlation between the proportion of Immigrants from Dominican Republic and labor force participation rate among population between the ages 16 and 19 in the United States with a correlation coefficient (R) of 0.165 and weighted average of 31.1%, a difference of 23.6%.
In Labor Force | Age 16-19 Correlation Summary
| Measurement | Hawaiian | Immigrants from Dominican Republic |
| Minimum | 5.6% | 8.7% |
| Maximum | 87.5% | 60.5% |
| Range | 81.9% | 51.8% |
| Mean | 39.4% | 33.0% |
| Median | 38.9% | 32.7% |
| Interquartile 25% (IQ1) | 32.1% | 26.5% |
| Interquartile 75% (IQ3) | 45.6% | 38.0% |
| Interquartile Range (IQR) | 13.5% | 11.5% |
| Standard Deviation (Sample) | 14.1% | 9.7% |
| Standard Deviation (Population) | 14.0% | 9.7% |
Similar Demographics by In Labor Force | Age 16-19
Demographics Similar to Hawaiians by In Labor Force | Age 16-19
In terms of in labor force | age 16-19, the demographic groups most similar to Hawaiians are Subsaharan African (38.4%, a difference of 0.10%), Bulgarian (38.3%, a difference of 0.15%), Colville (38.3%, a difference of 0.15%), Chickasaw (38.3%, a difference of 0.20%), and Immigrants from Nepal (38.3%, a difference of 0.21%).
| Demographics | Rating | Rank | In Labor Force | Age 16-19 |
| Chinese | 98.8 /100 | #107 | Exceptional 38.6% |
| Immigrants | Ethiopia | 98.7 /100 | #108 | Exceptional 38.6% |
| Lebanese | 98.7 /100 | #109 | Exceptional 38.6% |
| Maltese | 98.6 /100 | #110 | Exceptional 38.5% |
| Crow | 98.5 /100 | #111 | Exceptional 38.5% |
| Immigrants | Scotland | 98.5 /100 | #112 | Exceptional 38.5% |
| Sub-Saharan Africans | 98.3 /100 | #113 | Exceptional 38.4% |
| Hawaiians | 98.2 /100 | #114 | Exceptional 38.4% |
| Bulgarians | 97.9 /100 | #115 | Exceptional 38.3% |
| Colville | 97.9 /100 | #116 | Exceptional 38.3% |
| Chickasaw | 97.8 /100 | #117 | Exceptional 38.3% |
| Immigrants | Nepal | 97.8 /100 | #118 | Exceptional 38.3% |
| Assyrians/Chaldeans/Syriacs | 97.8 /100 | #119 | Exceptional 38.3% |
| Ukrainians | 97.6 /100 | #120 | Exceptional 38.3% |
| Ethiopians | 97.4 /100 | #121 | Exceptional 38.2% |
Demographics Similar to Immigrants from Dominican Republic by In Labor Force | Age 16-19
In terms of in labor force | age 16-19, the demographic groups most similar to Immigrants from Dominican Republic are Immigrants from Taiwan (31.0%, a difference of 0.16%), Immigrants from China (31.1%, a difference of 0.20%), Immigrants from Ecuador (31.0%, a difference of 0.20%), Barbadian (31.0%, a difference of 0.23%), and Dominican (31.2%, a difference of 0.35%).
| Demographics | Rating | Rank | In Labor Force | Age 16-19 |
| Soviet Union | 0.0 /100 | #319 | Tragic 31.4% |
| Ecuadorians | 0.0 /100 | #320 | Tragic 31.4% |
| West Indians | 0.0 /100 | #321 | Tragic 31.3% |
| Tohono O'odham | 0.0 /100 | #322 | Tragic 31.3% |
| Immigrants | Caribbean | 0.0 /100 | #323 | Tragic 31.2% |
| Dominicans | 0.0 /100 | #324 | Tragic 31.2% |
| Immigrants | China | 0.0 /100 | #325 | Tragic 31.1% |
| Immigrants | Dominican Republic | 0.0 /100 | #326 | Tragic 31.1% |
| Immigrants | Taiwan | 0.0 /100 | #327 | Tragic 31.0% |
| Immigrants | Ecuador | 0.0 /100 | #328 | Tragic 31.0% |
| Barbadians | 0.0 /100 | #329 | Tragic 31.0% |
| Lumbee | 0.0 /100 | #330 | Tragic 31.0% |
| Trinidadians and Tobagonians | 0.0 /100 | #331 | Tragic 30.9% |
| Immigrants | Israel | 0.0 /100 | #332 | Tragic 30.5% |
| Immigrants | Hong Kong | 0.0 /100 | #333 | Tragic 30.5% |