Hawaiian vs Japanese In Labor Force | Age 16-19
COMPARE
Hawaiian
Japanese
In Labor Force | Age 16-19
In Labor Force | Age 16-19 Comparison
Hawaiians
Japanese
38.4%
IN LABOR FORCE | AGE 16-19
98.2/ 100
METRIC RATING
114th/ 347
METRIC RANK
37.5%
IN LABOR FORCE | AGE 16-19
89.3/ 100
METRIC RATING
144th/ 347
METRIC RANK
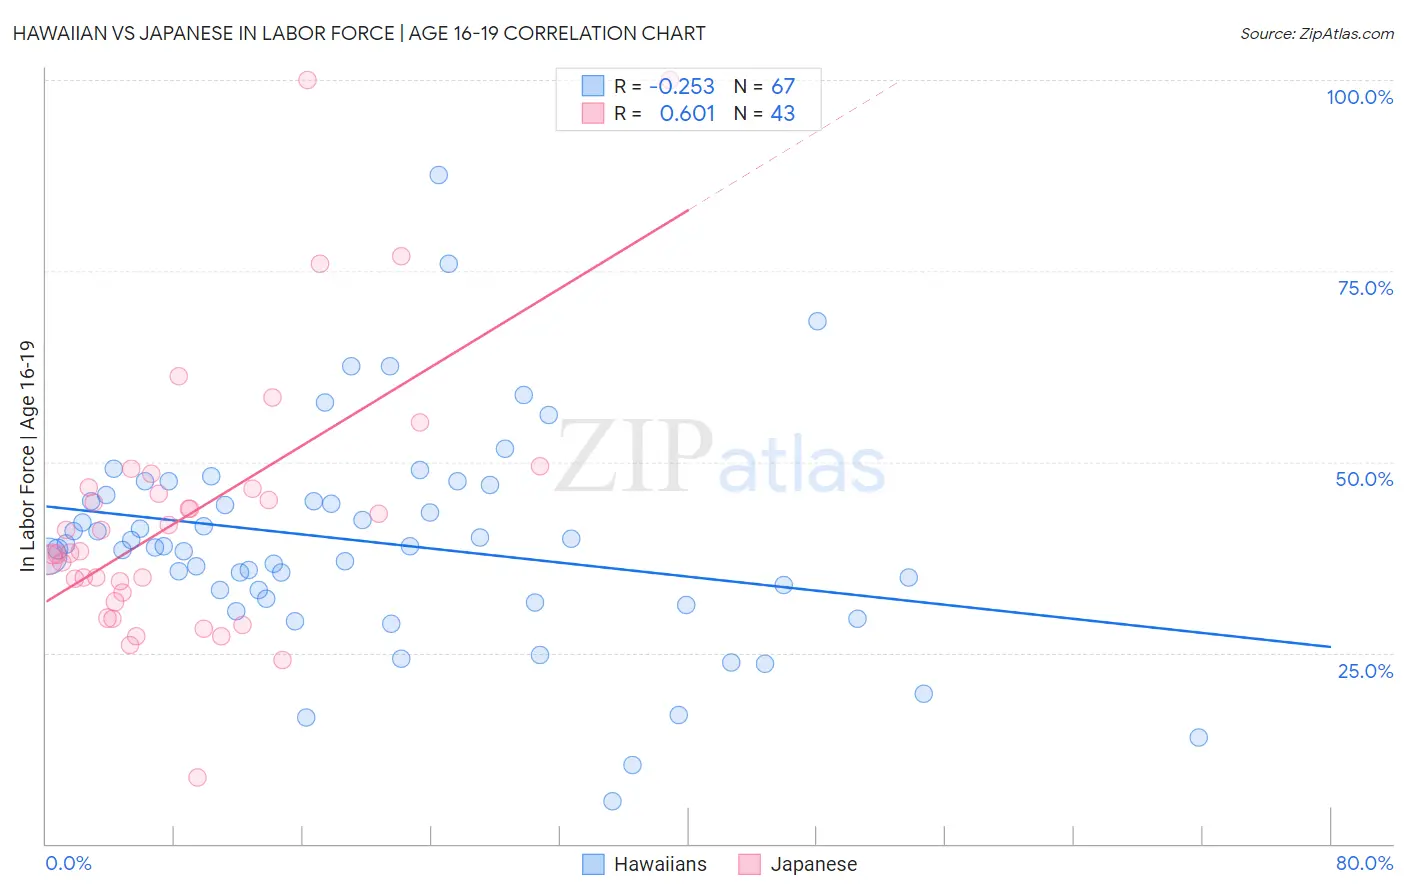
Hawaiian vs Japanese In Labor Force | Age 16-19 Correlation Chart
The statistical analysis conducted on geographies consisting of 327,147,423 people shows a weak negative correlation between the proportion of Hawaiians and labor force participation rate among population between the ages 16 and 19 in the United States with a correlation coefficient (R) of -0.253 and weighted average of 38.4%. Similarly, the statistical analysis conducted on geographies consisting of 249,091,187 people shows a significant positive correlation between the proportion of Japanese and labor force participation rate among population between the ages 16 and 19 in the United States with a correlation coefficient (R) of 0.601 and weighted average of 37.5%, a difference of 2.3%.
In Labor Force | Age 16-19 Correlation Summary
| Measurement | Hawaiian | Japanese |
| Minimum | 5.6% | 8.6% |
| Maximum | 87.5% | 100.0% |
| Range | 81.9% | 91.4% |
| Mean | 39.4% | 43.1% |
| Median | 38.9% | 38.2% |
| Interquartile 25% (IQ1) | 32.1% | 32.8% |
| Interquartile 75% (IQ3) | 45.6% | 46.7% |
| Interquartile Range (IQR) | 13.5% | 13.8% |
| Standard Deviation (Sample) | 14.1% | 17.9% |
| Standard Deviation (Population) | 14.0% | 17.7% |
Similar Demographics by In Labor Force | Age 16-19
Demographics Similar to Hawaiians by In Labor Force | Age 16-19
In terms of in labor force | age 16-19, the demographic groups most similar to Hawaiians are Subsaharan African (38.4%, a difference of 0.10%), Bulgarian (38.3%, a difference of 0.15%), Colville (38.3%, a difference of 0.15%), Chickasaw (38.3%, a difference of 0.20%), and Immigrants from Nepal (38.3%, a difference of 0.21%).
| Demographics | Rating | Rank | In Labor Force | Age 16-19 |
| Chinese | 98.8 /100 | #107 | Exceptional 38.6% |
| Immigrants | Ethiopia | 98.7 /100 | #108 | Exceptional 38.6% |
| Lebanese | 98.7 /100 | #109 | Exceptional 38.6% |
| Maltese | 98.6 /100 | #110 | Exceptional 38.5% |
| Crow | 98.5 /100 | #111 | Exceptional 38.5% |
| Immigrants | Scotland | 98.5 /100 | #112 | Exceptional 38.5% |
| Sub-Saharan Africans | 98.3 /100 | #113 | Exceptional 38.4% |
| Hawaiians | 98.2 /100 | #114 | Exceptional 38.4% |
| Bulgarians | 97.9 /100 | #115 | Exceptional 38.3% |
| Colville | 97.9 /100 | #116 | Exceptional 38.3% |
| Chickasaw | 97.8 /100 | #117 | Exceptional 38.3% |
| Immigrants | Nepal | 97.8 /100 | #118 | Exceptional 38.3% |
| Assyrians/Chaldeans/Syriacs | 97.8 /100 | #119 | Exceptional 38.3% |
| Ukrainians | 97.6 /100 | #120 | Exceptional 38.3% |
| Ethiopians | 97.4 /100 | #121 | Exceptional 38.2% |
Demographics Similar to Japanese by In Labor Force | Age 16-19
In terms of in labor force | age 16-19, the demographic groups most similar to Japanese are Paiute (37.5%, a difference of 0.0%), Pakistani (37.6%, a difference of 0.020%), Sierra Leonean (37.6%, a difference of 0.050%), Immigrants from Western Europe (37.5%, a difference of 0.050%), and Brazilian (37.5%, a difference of 0.080%).
| Demographics | Rating | Rank | In Labor Force | Age 16-19 |
| Cajuns | 93.2 /100 | #137 | Exceptional 37.8% |
| Comanche | 91.9 /100 | #138 | Exceptional 37.7% |
| Immigrants | Moldova | 91.9 /100 | #139 | Exceptional 37.7% |
| Estonians | 91.7 /100 | #140 | Exceptional 37.7% |
| Syrians | 90.7 /100 | #141 | Exceptional 37.6% |
| Sierra Leoneans | 89.7 /100 | #142 | Excellent 37.6% |
| Pakistanis | 89.5 /100 | #143 | Excellent 37.6% |
| Japanese | 89.3 /100 | #144 | Excellent 37.5% |
| Paiute | 89.3 /100 | #145 | Excellent 37.5% |
| Immigrants | Western Europe | 88.9 /100 | #146 | Excellent 37.5% |
| Brazilians | 88.7 /100 | #147 | Excellent 37.5% |
| Romanians | 87.3 /100 | #148 | Excellent 37.5% |
| Native Hawaiians | 85.0 /100 | #149 | Excellent 37.4% |
| Tsimshian | 84.7 /100 | #150 | Excellent 37.4% |
| Immigrants | Poland | 84.4 /100 | #151 | Excellent 37.3% |