Hawaiian vs Immigrants from Australia In Labor Force | Age 16-19
COMPARE
Hawaiian
Immigrants from Australia
In Labor Force | Age 16-19
In Labor Force | Age 16-19 Comparison
Hawaiians
Immigrants from Australia
38.4%
IN LABOR FORCE | AGE 16-19
98.2/ 100
METRIC RATING
114th/ 347
METRIC RANK
35.1%
IN LABOR FORCE | AGE 16-19
3.6/ 100
METRIC RATING
236th/ 347
METRIC RANK
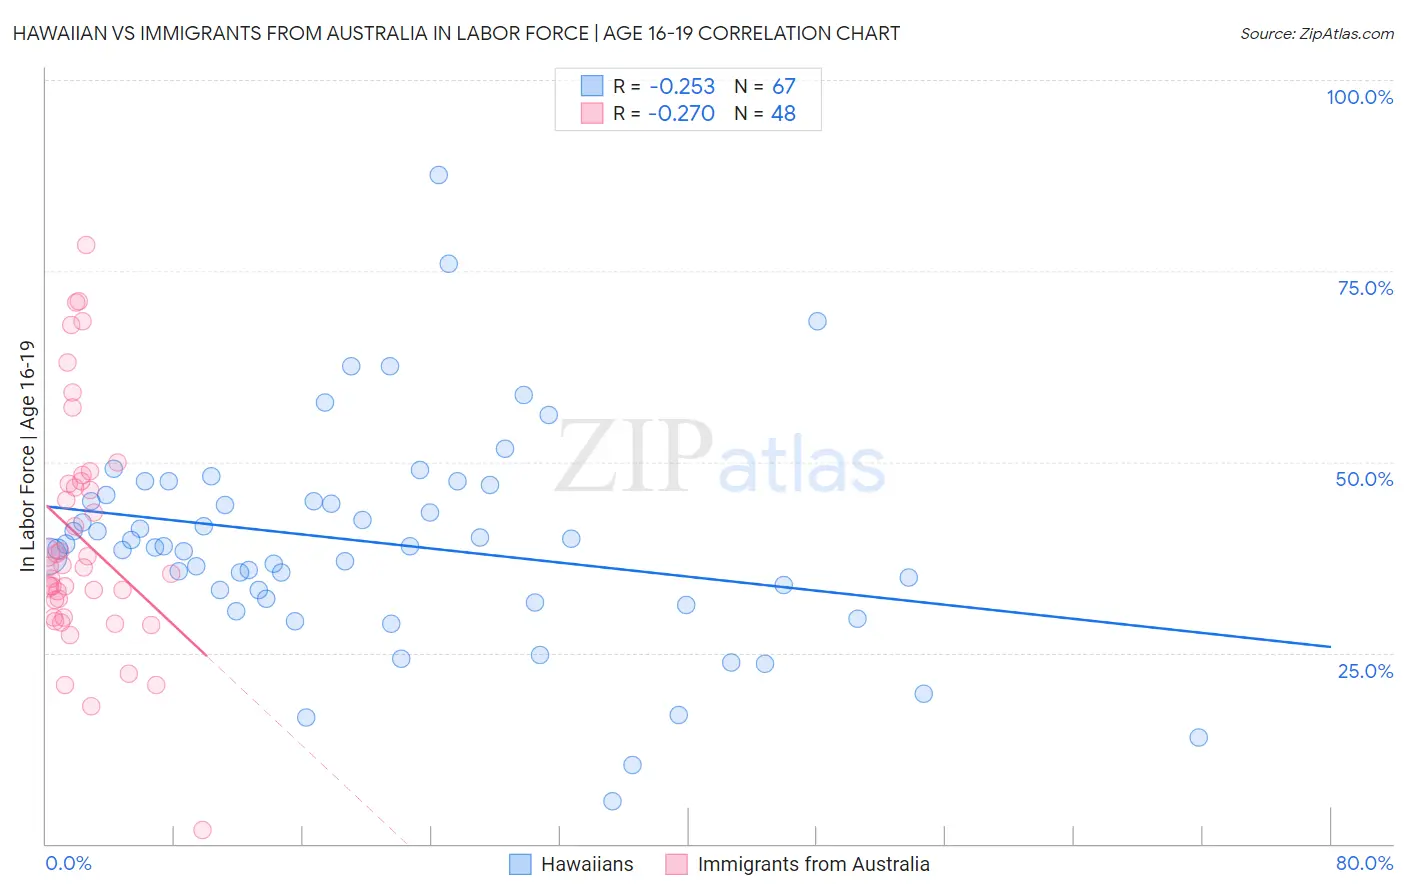
Hawaiian vs Immigrants from Australia In Labor Force | Age 16-19 Correlation Chart
The statistical analysis conducted on geographies consisting of 327,147,423 people shows a weak negative correlation between the proportion of Hawaiians and labor force participation rate among population between the ages 16 and 19 in the United States with a correlation coefficient (R) of -0.253 and weighted average of 38.4%. Similarly, the statistical analysis conducted on geographies consisting of 226,866,182 people shows a weak negative correlation between the proportion of Immigrants from Australia and labor force participation rate among population between the ages 16 and 19 in the United States with a correlation coefficient (R) of -0.270 and weighted average of 35.1%, a difference of 9.6%.
In Labor Force | Age 16-19 Correlation Summary
| Measurement | Hawaiian | Immigrants from Australia |
| Minimum | 5.6% | 1.8% |
| Maximum | 87.5% | 78.4% |
| Range | 81.9% | 76.6% |
| Mean | 39.4% | 39.9% |
| Median | 38.9% | 36.2% |
| Interquartile 25% (IQ1) | 32.1% | 30.8% |
| Interquartile 75% (IQ3) | 45.6% | 47.3% |
| Interquartile Range (IQR) | 13.5% | 16.5% |
| Standard Deviation (Sample) | 14.1% | 15.3% |
| Standard Deviation (Population) | 14.0% | 15.2% |
Similar Demographics by In Labor Force | Age 16-19
Demographics Similar to Hawaiians by In Labor Force | Age 16-19
In terms of in labor force | age 16-19, the demographic groups most similar to Hawaiians are Subsaharan African (38.4%, a difference of 0.10%), Bulgarian (38.3%, a difference of 0.15%), Colville (38.3%, a difference of 0.15%), Chickasaw (38.3%, a difference of 0.20%), and Immigrants from Nepal (38.3%, a difference of 0.21%).
| Demographics | Rating | Rank | In Labor Force | Age 16-19 |
| Chinese | 98.8 /100 | #107 | Exceptional 38.6% |
| Immigrants | Ethiopia | 98.7 /100 | #108 | Exceptional 38.6% |
| Lebanese | 98.7 /100 | #109 | Exceptional 38.6% |
| Maltese | 98.6 /100 | #110 | Exceptional 38.5% |
| Crow | 98.5 /100 | #111 | Exceptional 38.5% |
| Immigrants | Scotland | 98.5 /100 | #112 | Exceptional 38.5% |
| Sub-Saharan Africans | 98.3 /100 | #113 | Exceptional 38.4% |
| Hawaiians | 98.2 /100 | #114 | Exceptional 38.4% |
| Bulgarians | 97.9 /100 | #115 | Exceptional 38.3% |
| Colville | 97.9 /100 | #116 | Exceptional 38.3% |
| Chickasaw | 97.8 /100 | #117 | Exceptional 38.3% |
| Immigrants | Nepal | 97.8 /100 | #118 | Exceptional 38.3% |
| Assyrians/Chaldeans/Syriacs | 97.8 /100 | #119 | Exceptional 38.3% |
| Ukrainians | 97.6 /100 | #120 | Exceptional 38.3% |
| Ethiopians | 97.4 /100 | #121 | Exceptional 38.2% |
Demographics Similar to Immigrants from Australia by In Labor Force | Age 16-19
In terms of in labor force | age 16-19, the demographic groups most similar to Immigrants from Australia are Immigrants from India (35.0%, a difference of 0.030%), Immigrants from Vietnam (35.0%, a difference of 0.070%), Immigrants from Philippines (35.1%, a difference of 0.14%), Inupiat (35.0%, a difference of 0.16%), and Immigrants from Mexico (35.1%, a difference of 0.22%).
| Demographics | Rating | Rank | In Labor Force | Age 16-19 |
| Immigrants | Lebanon | 5.0 /100 | #229 | Tragic 35.2% |
| Immigrants | Honduras | 4.9 /100 | #230 | Tragic 35.2% |
| Immigrants | Syria | 4.5 /100 | #231 | Tragic 35.2% |
| Immigrants | Kazakhstan | 4.5 /100 | #232 | Tragic 35.2% |
| Immigrants | France | 4.3 /100 | #233 | Tragic 35.1% |
| Immigrants | Mexico | 4.2 /100 | #234 | Tragic 35.1% |
| Immigrants | Philippines | 4.0 /100 | #235 | Tragic 35.1% |
| Immigrants | Australia | 3.6 /100 | #236 | Tragic 35.1% |
| Immigrants | India | 3.5 /100 | #237 | Tragic 35.0% |
| Immigrants | Vietnam | 3.4 /100 | #238 | Tragic 35.0% |
| Inupiat | 3.2 /100 | #239 | Tragic 35.0% |
| Immigrants | Central America | 3.0 /100 | #240 | Tragic 35.0% |
| Immigrants | Ireland | 2.9 /100 | #241 | Tragic 35.0% |
| Uruguayans | 2.6 /100 | #242 | Tragic 34.9% |
| Pueblo | 2.6 /100 | #243 | Tragic 34.9% |