Immigrants from Egypt vs U.S. Virgin Islander In Labor Force | Age > 16
COMPARE
Immigrants from Egypt
U.S. Virgin Islander
In Labor Force | Age > 16
In Labor Force | Age > 16 Comparison
Immigrants from Egypt
U.S. Virgin Islanders
66.2%
IN LABOR FORCE | AGE > 16
99.7/ 100
METRIC RATING
68th/ 347
METRIC RANK
64.7%
IN LABOR FORCE | AGE > 16
11.3/ 100
METRIC RATING
217th/ 347
METRIC RANK
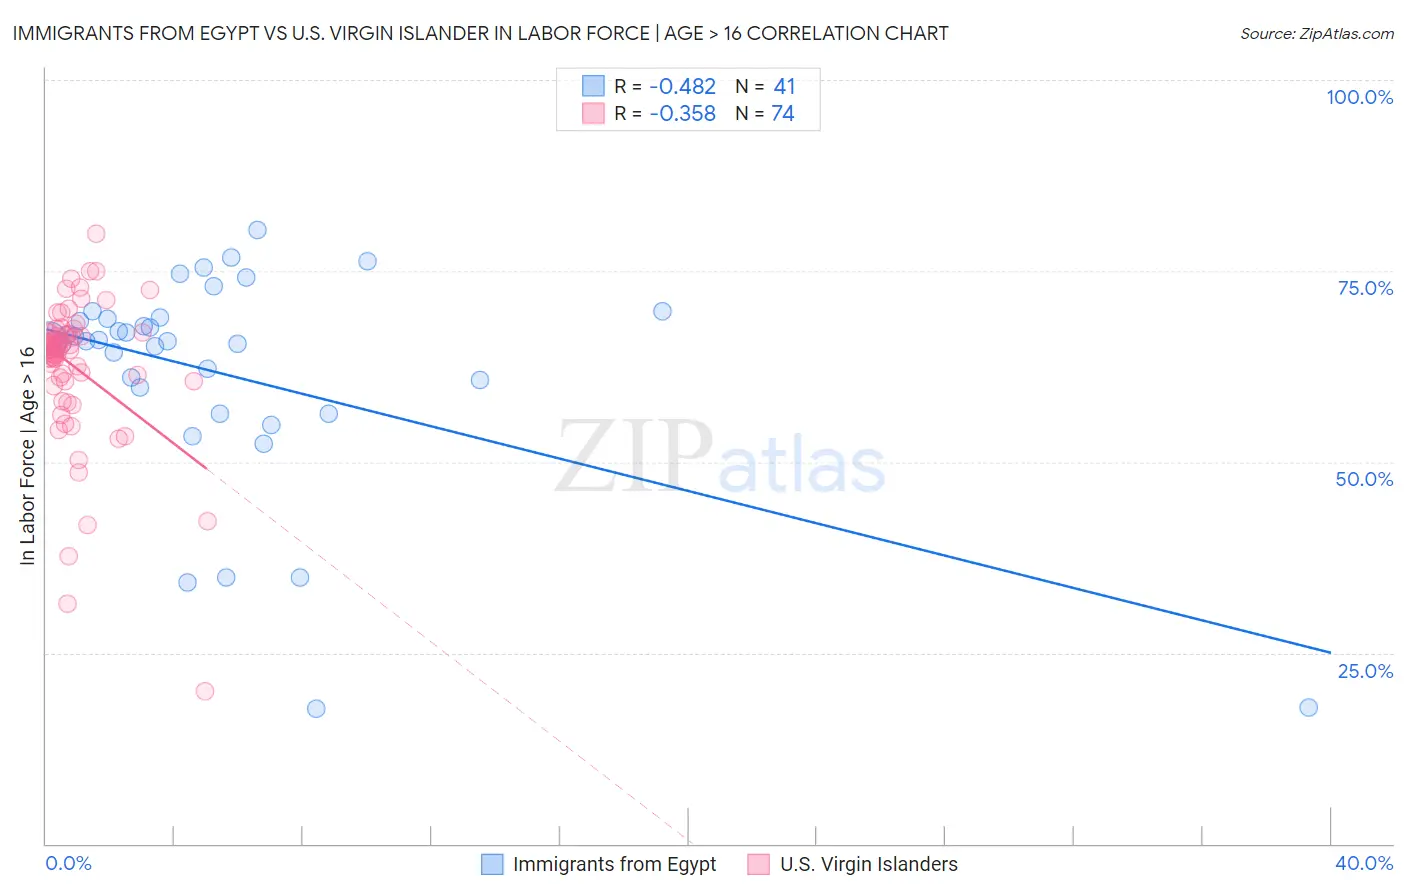
Immigrants from Egypt vs U.S. Virgin Islander In Labor Force | Age > 16 Correlation Chart
The statistical analysis conducted on geographies consisting of 245,493,461 people shows a moderate negative correlation between the proportion of Immigrants from Egypt and labor force participation rate among population ages 16 and over in the United States with a correlation coefficient (R) of -0.482 and weighted average of 66.2%. Similarly, the statistical analysis conducted on geographies consisting of 87,527,161 people shows a mild negative correlation between the proportion of U.S. Virgin Islanders and labor force participation rate among population ages 16 and over in the United States with a correlation coefficient (R) of -0.358 and weighted average of 64.7%, a difference of 2.3%.
In Labor Force | Age > 16 Correlation Summary
| Measurement | Immigrants from Egypt | U.S. Virgin Islander |
| Minimum | 17.6% | 19.9% |
| Maximum | 80.4% | 79.8% |
| Range | 62.8% | 59.9% |
| Mean | 61.6% | 62.4% |
| Median | 65.8% | 64.8% |
| Interquartile 25% (IQ1) | 58.0% | 60.6% |
| Interquartile 75% (IQ3) | 68.8% | 66.8% |
| Interquartile Range (IQR) | 10.8% | 6.2% |
| Standard Deviation (Sample) | 14.4% | 9.7% |
| Standard Deviation (Population) | 14.3% | 9.6% |
Similar Demographics by In Labor Force | Age > 16
Demographics Similar to Immigrants from Egypt by In Labor Force | Age > 16
In terms of in labor force | age > 16, the demographic groups most similar to Immigrants from Egypt are Subsaharan African (66.2%, a difference of 0.0%), Asian (66.2%, a difference of 0.010%), Burmese (66.2%, a difference of 0.030%), Taiwanese (66.2%, a difference of 0.030%), and Immigrants from Vietnam (66.2%, a difference of 0.040%).
| Demographics | Rating | Rank | In Labor Force | Age > 16 |
| Immigrants | Burma/Myanmar | 99.8 /100 | #61 | Exceptional 66.3% |
| Indonesians | 99.8 /100 | #62 | Exceptional 66.3% |
| Venezuelans | 99.8 /100 | #63 | Exceptional 66.3% |
| Peruvians | 99.8 /100 | #64 | Exceptional 66.3% |
| Sri Lankans | 99.8 /100 | #65 | Exceptional 66.3% |
| Jordanians | 99.8 /100 | #66 | Exceptional 66.3% |
| Egyptians | 99.8 /100 | #67 | Exceptional 66.2% |
| Immigrants | Egypt | 99.7 /100 | #68 | Exceptional 66.2% |
| Sub-Saharan Africans | 99.7 /100 | #69 | Exceptional 66.2% |
| Asians | 99.7 /100 | #70 | Exceptional 66.2% |
| Burmese | 99.7 /100 | #71 | Exceptional 66.2% |
| Taiwanese | 99.7 /100 | #72 | Exceptional 66.2% |
| Immigrants | Vietnam | 99.7 /100 | #73 | Exceptional 66.2% |
| Immigrants | Korea | 99.7 /100 | #74 | Exceptional 66.2% |
| Immigrants | Singapore | 99.7 /100 | #75 | Exceptional 66.2% |
Demographics Similar to U.S. Virgin Islanders by In Labor Force | Age > 16
In terms of in labor force | age > 16, the demographic groups most similar to U.S. Virgin Islanders are Belgian (64.7%, a difference of 0.0%), Alsatian (64.7%, a difference of 0.020%), Immigrants from Central America (64.7%, a difference of 0.020%), Immigrants from Czechoslovakia (64.8%, a difference of 0.030%), and Alaska Native (64.7%, a difference of 0.040%).
| Demographics | Rating | Rank | In Labor Force | Age > 16 |
| Immigrants | Denmark | 14.7 /100 | #210 | Poor 64.8% |
| Fijians | 14.1 /100 | #211 | Poor 64.8% |
| Alaskan Athabascans | 13.9 /100 | #212 | Poor 64.8% |
| Maltese | 13.8 /100 | #213 | Poor 64.8% |
| Estonians | 13.1 /100 | #214 | Poor 64.8% |
| Immigrants | Czechoslovakia | 12.3 /100 | #215 | Poor 64.8% |
| Belgians | 11.4 /100 | #216 | Poor 64.7% |
| U.S. Virgin Islanders | 11.3 /100 | #217 | Poor 64.7% |
| Alsatians | 10.7 /100 | #218 | Poor 64.7% |
| Immigrants | Central America | 10.5 /100 | #219 | Poor 64.7% |
| Alaska Natives | 9.9 /100 | #220 | Tragic 64.7% |
| Immigrants | Micronesia | 9.6 /100 | #221 | Tragic 64.7% |
| Hawaiians | 9.3 /100 | #222 | Tragic 64.7% |
| Immigrants | Belize | 9.2 /100 | #223 | Tragic 64.7% |
| Immigrants | Jamaica | 8.8 /100 | #224 | Tragic 64.7% |