Guyanese vs Lumbee Bachelor's Degree
COMPARE
Guyanese
Lumbee
Bachelor's Degree
Bachelor's Degree Comparison
Guyanese
Lumbee
34.5%
BACHELOR'S DEGREE
2.5/ 100
METRIC RATING
238th/ 347
METRIC RANK
24.8%
BACHELOR'S DEGREE
0.0/ 100
METRIC RATING
340th/ 347
METRIC RANK
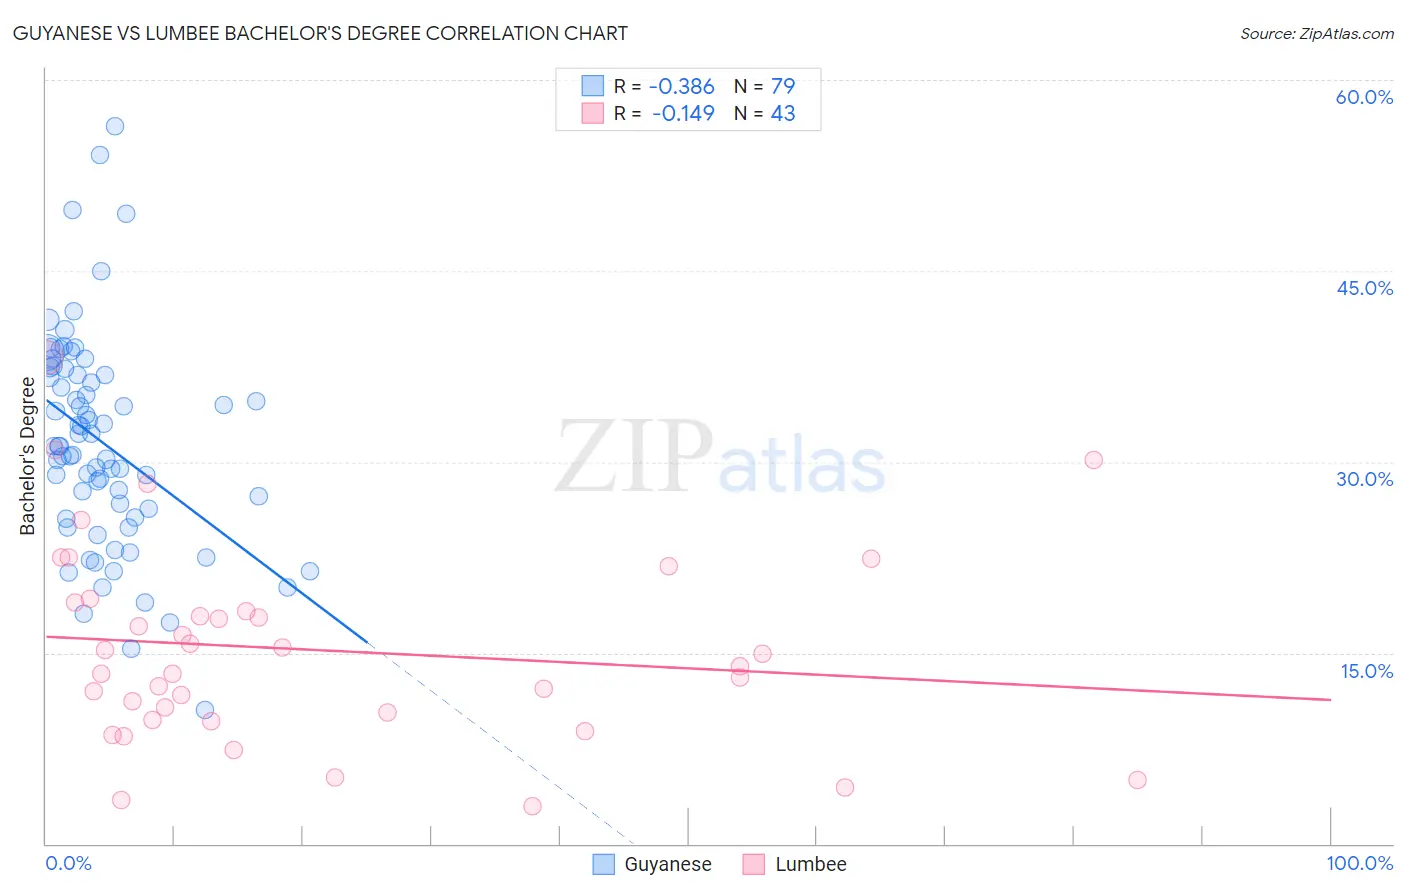
Guyanese vs Lumbee Bachelor's Degree Correlation Chart
The statistical analysis conducted on geographies consisting of 176,919,737 people shows a mild negative correlation between the proportion of Guyanese and percentage of population with at least bachelor's degree education in the United States with a correlation coefficient (R) of -0.386 and weighted average of 34.5%. Similarly, the statistical analysis conducted on geographies consisting of 92,297,287 people shows a poor negative correlation between the proportion of Lumbee and percentage of population with at least bachelor's degree education in the United States with a correlation coefficient (R) of -0.149 and weighted average of 24.8%, a difference of 39.2%.
Bachelor's Degree Correlation Summary
| Measurement | Guyanese | Lumbee |
| Minimum | 10.5% | 2.9% |
| Maximum | 56.4% | 38.2% |
| Range | 45.9% | 35.2% |
| Mean | 31.5% | 15.2% |
| Median | 31.2% | 13.9% |
| Interquartile 25% (IQ1) | 25.6% | 9.7% |
| Interquartile 75% (IQ3) | 36.9% | 19.0% |
| Interquartile Range (IQR) | 11.3% | 9.2% |
| Standard Deviation (Sample) | 8.4% | 7.7% |
| Standard Deviation (Population) | 8.4% | 7.6% |
Similar Demographics by Bachelor's Degree
Demographics Similar to Guyanese by Bachelor's Degree
In terms of bachelor's degree, the demographic groups most similar to Guyanese are British West Indian (34.5%, a difference of 0.020%), Tlingit-Haida (34.6%, a difference of 0.28%), Liberian (34.6%, a difference of 0.32%), Immigrants from West Indies (34.6%, a difference of 0.43%), and Guamanian/Chamorro (34.6%, a difference of 0.52%).
| Demographics | Rating | Rank | Bachelor's Degree |
| Immigrants | St. Vincent and the Grenadines | 4.3 /100 | #231 | Tragic 35.0% |
| Hmong | 3.4 /100 | #232 | Tragic 34.8% |
| Immigrants | Ecuador | 3.3 /100 | #233 | Tragic 34.7% |
| Guamanians/Chamorros | 3.0 /100 | #234 | Tragic 34.6% |
| Immigrants | West Indies | 2.9 /100 | #235 | Tragic 34.6% |
| Liberians | 2.8 /100 | #236 | Tragic 34.6% |
| Tlingit-Haida | 2.8 /100 | #237 | Tragic 34.6% |
| Guyanese | 2.5 /100 | #238 | Tragic 34.5% |
| British West Indians | 2.5 /100 | #239 | Tragic 34.5% |
| Tongans | 2.0 /100 | #240 | Tragic 34.3% |
| Immigrants | Cambodia | 1.9 /100 | #241 | Tragic 34.2% |
| Immigrants | Nonimmigrants | 1.8 /100 | #242 | Tragic 34.2% |
| Immigrants | Guyana | 1.4 /100 | #243 | Tragic 33.9% |
| Delaware | 1.2 /100 | #244 | Tragic 33.8% |
| Immigrants | Fiji | 1.2 /100 | #245 | Tragic 33.7% |
Demographics Similar to Lumbee by Bachelor's Degree
In terms of bachelor's degree, the demographic groups most similar to Lumbee are Yuman (24.5%, a difference of 0.92%), Yakama (24.5%, a difference of 1.2%), Tohono O'odham (24.4%, a difference of 1.4%), Hopi (25.3%, a difference of 2.2%), and Pueblo (25.5%, a difference of 3.2%).
| Demographics | Rating | Rank | Bachelor's Degree |
| Mexicans | 0.0 /100 | #333 | Tragic 27.1% |
| Arapaho | 0.0 /100 | #334 | Tragic 26.6% |
| Natives/Alaskans | 0.0 /100 | #335 | Tragic 26.3% |
| Immigrants | Mexico | 0.0 /100 | #336 | Tragic 26.1% |
| Inupiat | 0.0 /100 | #337 | Tragic 25.8% |
| Pueblo | 0.0 /100 | #338 | Tragic 25.5% |
| Hopi | 0.0 /100 | #339 | Tragic 25.3% |
| Lumbee | 0.0 /100 | #340 | Tragic 24.8% |
| Yuman | 0.0 /100 | #341 | Tragic 24.5% |
| Yakama | 0.0 /100 | #342 | Tragic 24.5% |
| Tohono O'odham | 0.0 /100 | #343 | Tragic 24.4% |
| Navajo | 0.0 /100 | #344 | Tragic 23.6% |
| Pima | 0.0 /100 | #345 | Tragic 23.2% |
| Houma | 0.0 /100 | #346 | Tragic 21.4% |
| Yup'ik | 0.0 /100 | #347 | Tragic 19.4% |