Immigrants from Denmark vs Lumbee In Labor Force | Age 45-54
COMPARE
Immigrants from Denmark
Lumbee
In Labor Force | Age 45-54
In Labor Force | Age 45-54 Comparison
Immigrants from Denmark
Lumbee
82.5%
IN LABOR FORCE | AGE 45-54
17.9/ 100
METRIC RATING
198th/ 347
METRIC RANK
75.6%
IN LABOR FORCE | AGE 45-54
0.0/ 100
METRIC RATING
340th/ 347
METRIC RANK
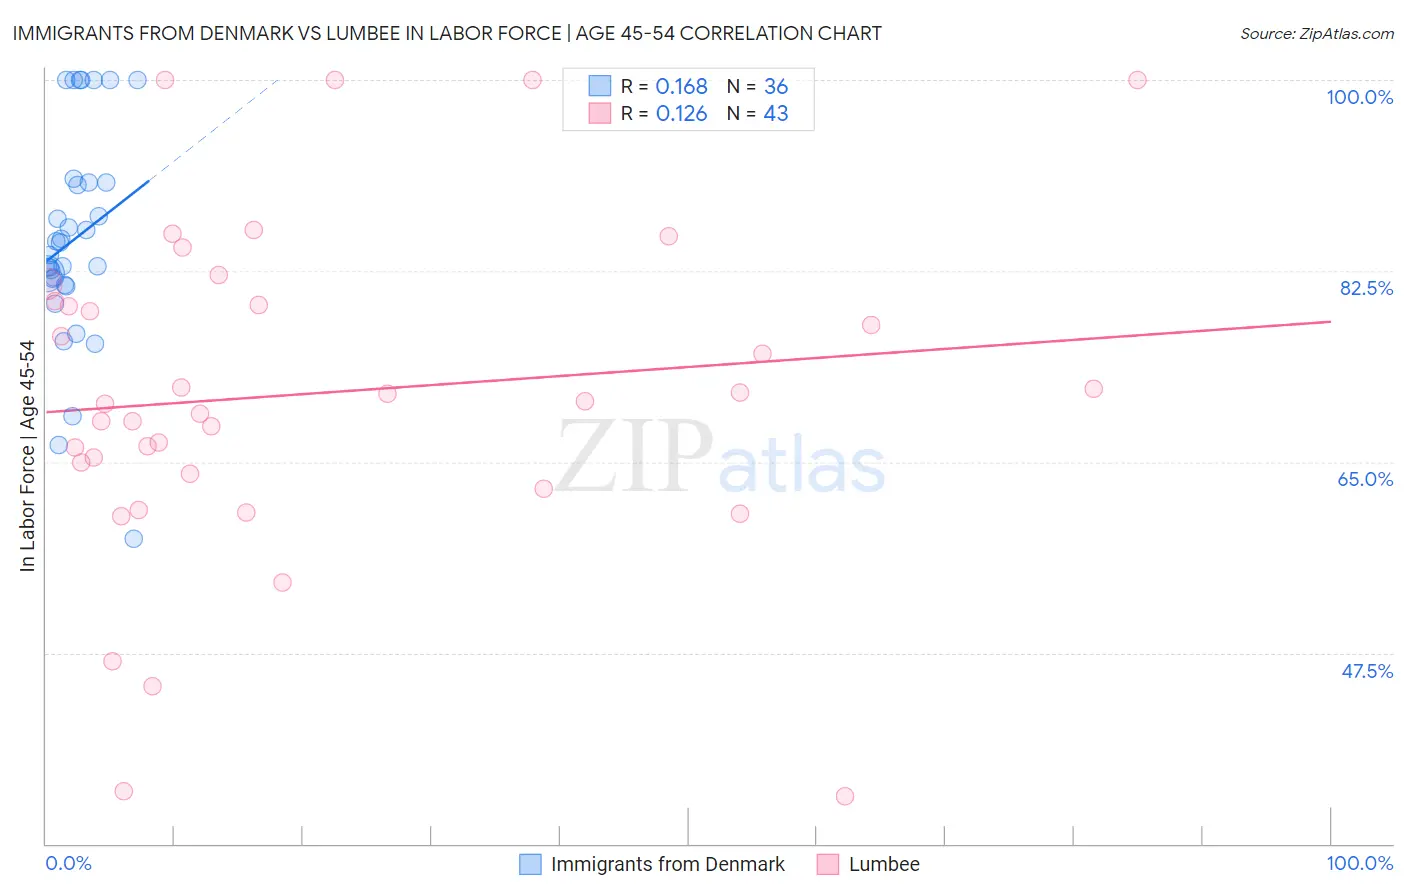
Immigrants from Denmark vs Lumbee In Labor Force | Age 45-54 Correlation Chart
The statistical analysis conducted on geographies consisting of 136,407,206 people shows a poor positive correlation between the proportion of Immigrants from Denmark and labor force participation rate among population between the ages 45 and 54 in the United States with a correlation coefficient (R) of 0.168 and weighted average of 82.5%. Similarly, the statistical analysis conducted on geographies consisting of 92,258,023 people shows a poor positive correlation between the proportion of Lumbee and labor force participation rate among population between the ages 45 and 54 in the United States with a correlation coefficient (R) of 0.126 and weighted average of 75.6%, a difference of 9.1%.
In Labor Force | Age 45-54 Correlation Summary
| Measurement | Immigrants from Denmark | Lumbee |
| Minimum | 58.0% | 34.3% |
| Maximum | 100.0% | 100.0% |
| Range | 42.0% | 65.7% |
| Mean | 85.4% | 71.3% |
| Median | 84.5% | 70.6% |
| Interquartile 25% (IQ1) | 81.5% | 63.9% |
| Interquartile 75% (IQ3) | 90.6% | 79.7% |
| Interquartile Range (IQR) | 9.1% | 15.8% |
| Standard Deviation (Sample) | 9.8% | 15.3% |
| Standard Deviation (Population) | 9.7% | 15.1% |
Similar Demographics by In Labor Force | Age 45-54
Demographics Similar to Immigrants from Denmark by In Labor Force | Age 45-54
In terms of in labor force | age 45-54, the demographic groups most similar to Immigrants from Denmark are Immigrants from North America (82.5%, a difference of 0.010%), Lebanese (82.5%, a difference of 0.010%), Immigrants from Canada (82.5%, a difference of 0.030%), Immigrants from Iraq (82.5%, a difference of 0.040%), and Australian (82.5%, a difference of 0.040%).
| Demographics | Rating | Rank | In Labor Force | Age 45-54 |
| Armenians | 23.2 /100 | #191 | Fair 82.5% |
| Immigrants | Iraq | 20.9 /100 | #192 | Fair 82.5% |
| Australians | 20.8 /100 | #193 | Fair 82.5% |
| Immigrants | Norway | 20.7 /100 | #194 | Fair 82.5% |
| Immigrants | Canada | 20.0 /100 | #195 | Fair 82.5% |
| Immigrants | North America | 18.8 /100 | #196 | Poor 82.5% |
| Lebanese | 18.2 /100 | #197 | Poor 82.5% |
| Immigrants | Denmark | 17.9 /100 | #198 | Poor 82.5% |
| Moroccans | 15.7 /100 | #199 | Poor 82.5% |
| French Canadians | 15.4 /100 | #200 | Poor 82.5% |
| Canadians | 15.1 /100 | #201 | Poor 82.4% |
| Immigrants | Western Asia | 14.9 /100 | #202 | Poor 82.4% |
| Arabs | 11.6 /100 | #203 | Poor 82.4% |
| Immigrants | Western Europe | 10.9 /100 | #204 | Poor 82.4% |
| Senegalese | 9.5 /100 | #205 | Tragic 82.4% |
Demographics Similar to Lumbee by In Labor Force | Age 45-54
In terms of in labor force | age 45-54, the demographic groups most similar to Lumbee are Pueblo (75.5%, a difference of 0.12%), Puerto Rican (75.9%, a difference of 0.46%), Tohono O'odham (75.1%, a difference of 0.61%), Hopi (75.0%, a difference of 0.79%), and Yuman (76.3%, a difference of 0.95%).
| Demographics | Rating | Rank | In Labor Force | Age 45-54 |
| Natives/Alaskans | 0.0 /100 | #333 | Tragic 77.1% |
| Apache | 0.0 /100 | #334 | Tragic 77.1% |
| Arapaho | 0.0 /100 | #335 | Tragic 77.1% |
| Paiute | 0.0 /100 | #336 | Tragic 76.7% |
| Ute | 0.0 /100 | #337 | Tragic 76.6% |
| Yuman | 0.0 /100 | #338 | Tragic 76.3% |
| Puerto Ricans | 0.0 /100 | #339 | Tragic 75.9% |
| Lumbee | 0.0 /100 | #340 | Tragic 75.6% |
| Pueblo | 0.0 /100 | #341 | Tragic 75.5% |
| Tohono O'odham | 0.0 /100 | #342 | Tragic 75.1% |
| Hopi | 0.0 /100 | #343 | Tragic 75.0% |
| Immigrants | Yemen | 0.0 /100 | #344 | Tragic 74.4% |
| Houma | 0.0 /100 | #345 | Tragic 74.1% |
| Pima | 0.0 /100 | #346 | Tragic 72.8% |
| Navajo | 0.0 /100 | #347 | Tragic 72.8% |