Guyanese vs Irish In Labor Force | Age 25-29
COMPARE
Guyanese
Irish
In Labor Force | Age 25-29
In Labor Force | Age 25-29 Comparison
Guyanese
Irish
83.0%
IN LABOR FORCE | AGE 25-29
0.0/ 100
METRIC RATING
287th/ 347
METRIC RANK
85.0%
IN LABOR FORCE | AGE 25-29
90.6/ 100
METRIC RATING
113th/ 347
METRIC RANK
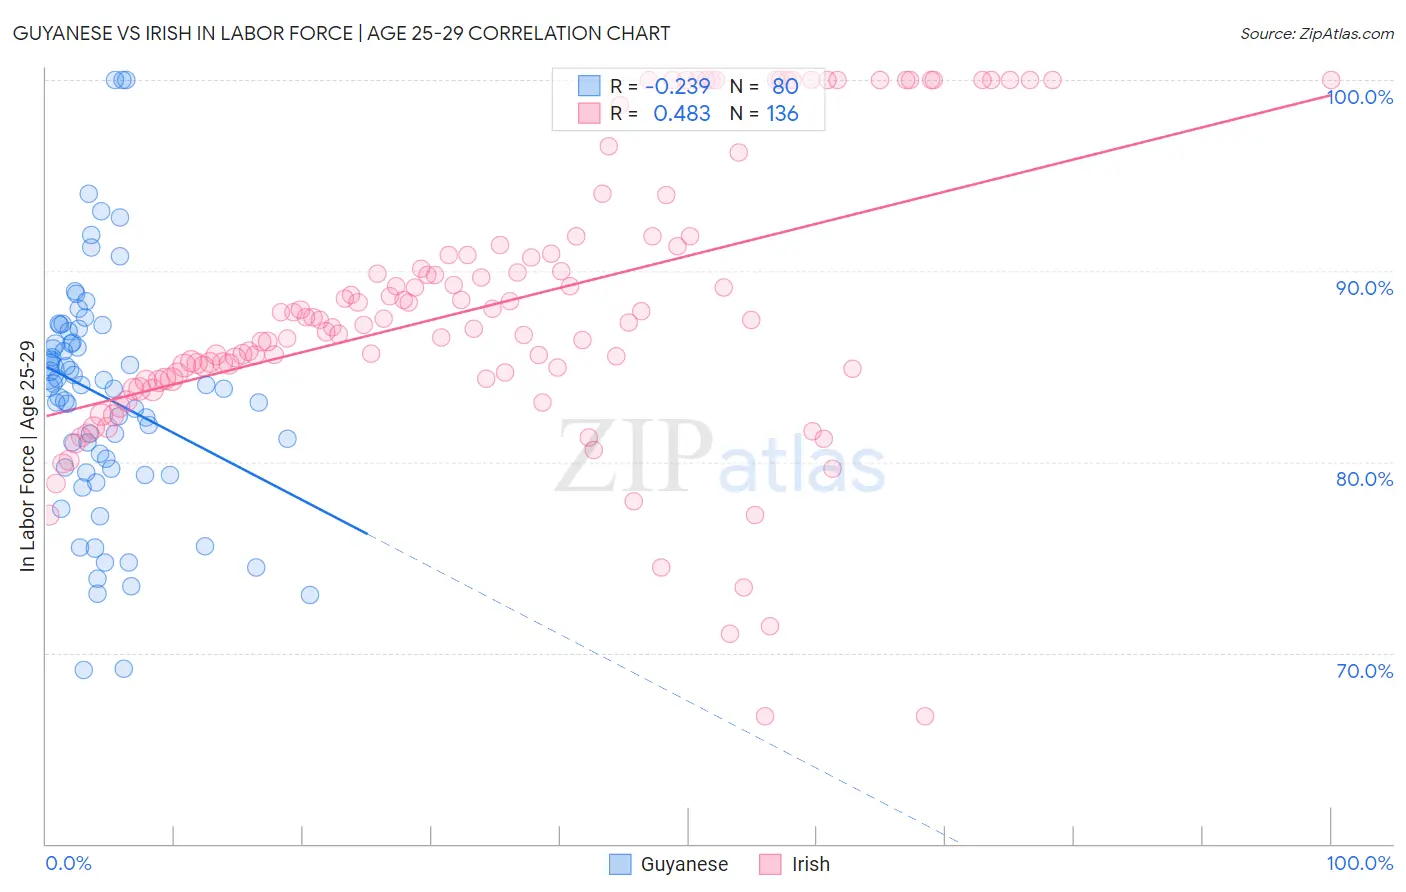
Guyanese vs Irish In Labor Force | Age 25-29 Correlation Chart
The statistical analysis conducted on geographies consisting of 176,912,088 people shows a weak negative correlation between the proportion of Guyanese and labor force participation rate among population between the ages 25 and 29 in the United States with a correlation coefficient (R) of -0.239 and weighted average of 83.0%. Similarly, the statistical analysis conducted on geographies consisting of 578,488,180 people shows a moderate positive correlation between the proportion of Irish and labor force participation rate among population between the ages 25 and 29 in the United States with a correlation coefficient (R) of 0.483 and weighted average of 85.0%, a difference of 2.4%.
In Labor Force | Age 25-29 Correlation Summary
| Measurement | Guyanese | Irish |
| Minimum | 69.1% | 66.7% |
| Maximum | 100.0% | 100.0% |
| Range | 30.9% | 33.3% |
| Mean | 83.4% | 88.2% |
| Median | 84.0% | 87.5% |
| Interquartile 25% (IQ1) | 79.7% | 84.3% |
| Interquartile 75% (IQ3) | 86.5% | 91.3% |
| Interquartile Range (IQR) | 6.8% | 7.0% |
| Standard Deviation (Sample) | 6.2% | 7.4% |
| Standard Deviation (Population) | 6.2% | 7.4% |
Similar Demographics by In Labor Force | Age 25-29
Demographics Similar to Guyanese by In Labor Force | Age 25-29
In terms of in labor force | age 25-29, the demographic groups most similar to Guyanese are Mexican American Indian (83.0%, a difference of 0.020%), Belizean (83.1%, a difference of 0.030%), Ottawa (83.0%, a difference of 0.030%), Immigrants from Micronesia (83.0%, a difference of 0.050%), and Nicaraguan (83.1%, a difference of 0.070%).
| Demographics | Rating | Rank | In Labor Force | Age 25-29 |
| Dominicans | 0.0 /100 | #280 | Tragic 83.2% |
| Immigrants | Dominican Republic | 0.0 /100 | #281 | Tragic 83.1% |
| Americans | 0.0 /100 | #282 | Tragic 83.1% |
| Immigrants | Azores | 0.0 /100 | #283 | Tragic 83.1% |
| Nicaraguans | 0.0 /100 | #284 | Tragic 83.1% |
| Belizeans | 0.0 /100 | #285 | Tragic 83.1% |
| Mexican American Indians | 0.0 /100 | #286 | Tragic 83.0% |
| Guyanese | 0.0 /100 | #287 | Tragic 83.0% |
| Ottawa | 0.0 /100 | #288 | Tragic 83.0% |
| Immigrants | Micronesia | 0.0 /100 | #289 | Tragic 83.0% |
| Immigrants | Bangladesh | 0.0 /100 | #290 | Tragic 83.0% |
| Hawaiians | 0.0 /100 | #291 | Tragic 83.0% |
| Immigrants | Guyana | 0.0 /100 | #292 | Tragic 83.0% |
| Immigrants | Latin America | 0.0 /100 | #293 | Tragic 82.9% |
| Nepalese | 0.0 /100 | #294 | Tragic 82.9% |
Demographics Similar to Irish by In Labor Force | Age 25-29
In terms of in labor force | age 25-29, the demographic groups most similar to Irish are Senegalese (85.0%, a difference of 0.010%), Immigrants from Malaysia (85.0%, a difference of 0.010%), New Zealander (85.0%, a difference of 0.020%), Immigrants from Middle Africa (85.0%, a difference of 0.020%), and Immigrants from Austria (85.0%, a difference of 0.030%).
| Demographics | Rating | Rank | In Labor Force | Age 25-29 |
| Czechoslovakians | 92.6 /100 | #106 | Exceptional 85.0% |
| Immigrants | Southern Europe | 92.3 /100 | #107 | Exceptional 85.0% |
| Immigrants | Austria | 91.9 /100 | #108 | Exceptional 85.0% |
| Costa Ricans | 91.9 /100 | #109 | Exceptional 85.0% |
| New Zealanders | 91.5 /100 | #110 | Exceptional 85.0% |
| Immigrants | Middle Africa | 91.4 /100 | #111 | Exceptional 85.0% |
| Senegalese | 90.9 /100 | #112 | Exceptional 85.0% |
| Irish | 90.6 /100 | #113 | Exceptional 85.0% |
| Immigrants | Malaysia | 90.4 /100 | #114 | Exceptional 85.0% |
| South Africans | 88.9 /100 | #115 | Excellent 85.0% |
| Chileans | 88.8 /100 | #116 | Excellent 85.0% |
| Immigrants | Belarus | 88.0 /100 | #117 | Excellent 85.0% |
| Finns | 87.8 /100 | #118 | Excellent 85.0% |
| Filipinos | 87.1 /100 | #119 | Excellent 84.9% |
| Immigrants | South Africa | 86.1 /100 | #120 | Excellent 84.9% |