Immigrants from Ethiopia vs Irish In Labor Force | Age 45-54
COMPARE
Immigrants from Ethiopia
Irish
In Labor Force | Age 45-54
In Labor Force | Age 45-54 Comparison
Immigrants from Ethiopia
Irish
84.8%
IN LABOR FORCE | AGE 45-54
100.0/ 100
METRIC RATING
4th/ 347
METRIC RANK
82.6%
IN LABOR FORCE | AGE 45-54
29.2/ 100
METRIC RATING
186th/ 347
METRIC RANK
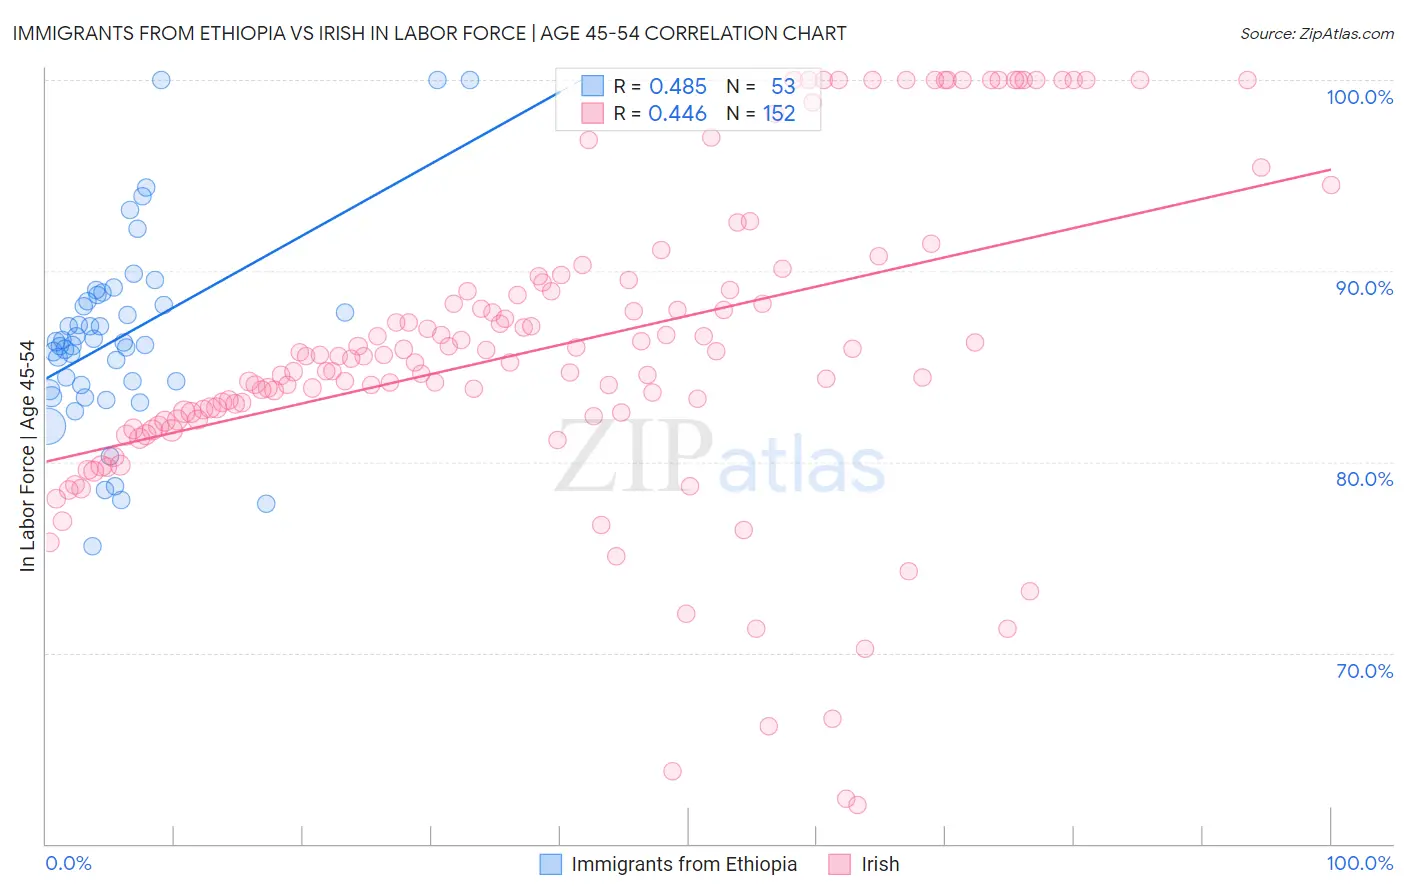
Immigrants from Ethiopia vs Irish In Labor Force | Age 45-54 Correlation Chart
The statistical analysis conducted on geographies consisting of 211,453,316 people shows a moderate positive correlation between the proportion of Immigrants from Ethiopia and labor force participation rate among population between the ages 45 and 54 in the United States with a correlation coefficient (R) of 0.485 and weighted average of 84.8%. Similarly, the statistical analysis conducted on geographies consisting of 579,633,404 people shows a moderate positive correlation between the proportion of Irish and labor force participation rate among population between the ages 45 and 54 in the United States with a correlation coefficient (R) of 0.446 and weighted average of 82.6%, a difference of 2.7%.
In Labor Force | Age 45-54 Correlation Summary
| Measurement | Immigrants from Ethiopia | Irish |
| Minimum | 75.6% | 62.0% |
| Maximum | 100.0% | 100.0% |
| Range | 24.4% | 38.0% |
| Mean | 86.6% | 86.0% |
| Median | 86.2% | 85.5% |
| Interquartile 25% (IQ1) | 83.9% | 82.3% |
| Interquartile 75% (IQ3) | 88.6% | 89.2% |
| Interquartile Range (IQR) | 4.7% | 6.9% |
| Standard Deviation (Sample) | 5.1% | 8.2% |
| Standard Deviation (Population) | 5.0% | 8.2% |
Similar Demographics by In Labor Force | Age 45-54
Demographics Similar to Immigrants from Ethiopia by In Labor Force | Age 45-54
In terms of in labor force | age 45-54, the demographic groups most similar to Immigrants from Ethiopia are Ethiopian (84.8%, a difference of 0.080%), Bolivian (84.9%, a difference of 0.12%), Immigrants from India (84.7%, a difference of 0.19%), Luxembourger (85.0%, a difference of 0.21%), and Immigrants from Cameroon (84.6%, a difference of 0.25%).
| Demographics | Rating | Rank | In Labor Force | Age 45-54 |
| Immigrants | Bolivia | 100.0 /100 | #1 | Exceptional 85.3% |
| Luxembourgers | 100.0 /100 | #2 | Exceptional 85.0% |
| Bolivians | 100.0 /100 | #3 | Exceptional 84.9% |
| Immigrants | Ethiopia | 100.0 /100 | #4 | Exceptional 84.8% |
| Ethiopians | 100.0 /100 | #5 | Exceptional 84.8% |
| Immigrants | India | 100.0 /100 | #6 | Exceptional 84.7% |
| Immigrants | Cameroon | 100.0 /100 | #7 | Exceptional 84.6% |
| Sierra Leoneans | 100.0 /100 | #8 | Exceptional 84.5% |
| Immigrants | Sierra Leone | 100.0 /100 | #9 | Exceptional 84.4% |
| Norwegians | 100.0 /100 | #10 | Exceptional 84.4% |
| Thais | 100.0 /100 | #11 | Exceptional 84.3% |
| Bulgarians | 100.0 /100 | #12 | Exceptional 84.2% |
| Chinese | 99.9 /100 | #13 | Exceptional 84.1% |
| Cambodians | 99.9 /100 | #14 | Exceptional 84.1% |
| Cypriots | 99.9 /100 | #15 | Exceptional 84.1% |
Demographics Similar to Irish by In Labor Force | Age 45-54
In terms of in labor force | age 45-54, the demographic groups most similar to Irish are Immigrants from Costa Rica (82.6%, a difference of 0.010%), South African (82.6%, a difference of 0.010%), Immigrants from England (82.6%, a difference of 0.030%), Syrian (82.6%, a difference of 0.030%), and New Zealander (82.6%, a difference of 0.040%).
| Demographics | Rating | Rank | In Labor Force | Age 45-54 |
| Immigrants | Switzerland | 39.4 /100 | #179 | Fair 82.7% |
| Hungarians | 38.0 /100 | #180 | Fair 82.7% |
| Israelis | 37.7 /100 | #181 | Fair 82.7% |
| Immigrants | Hungary | 37.1 /100 | #182 | Fair 82.7% |
| New Zealanders | 32.7 /100 | #183 | Fair 82.6% |
| Europeans | 32.6 /100 | #184 | Fair 82.6% |
| Immigrants | England | 32.2 /100 | #185 | Fair 82.6% |
| Irish | 29.2 /100 | #186 | Fair 82.6% |
| Immigrants | Costa Rica | 28.3 /100 | #187 | Fair 82.6% |
| South Africans | 28.0 /100 | #188 | Fair 82.6% |
| Syrians | 26.0 /100 | #189 | Fair 82.6% |
| British | 25.7 /100 | #190 | Fair 82.6% |
| Armenians | 23.2 /100 | #191 | Fair 82.5% |
| Immigrants | Iraq | 20.9 /100 | #192 | Fair 82.5% |
| Australians | 20.8 /100 | #193 | Fair 82.5% |