German vs Belizean In Labor Force | Age 20-64
COMPARE
German
Belizean
In Labor Force | Age 20-64
In Labor Force | Age 20-64 Comparison
Germans
Belizeans
79.7%
IN LABOR FORCE | AGE 20-64
65.2/ 100
METRIC RATING
162nd/ 347
METRIC RANK
78.2%
IN LABOR FORCE | AGE 20-64
0.0/ 100
METRIC RATING
279th/ 347
METRIC RANK
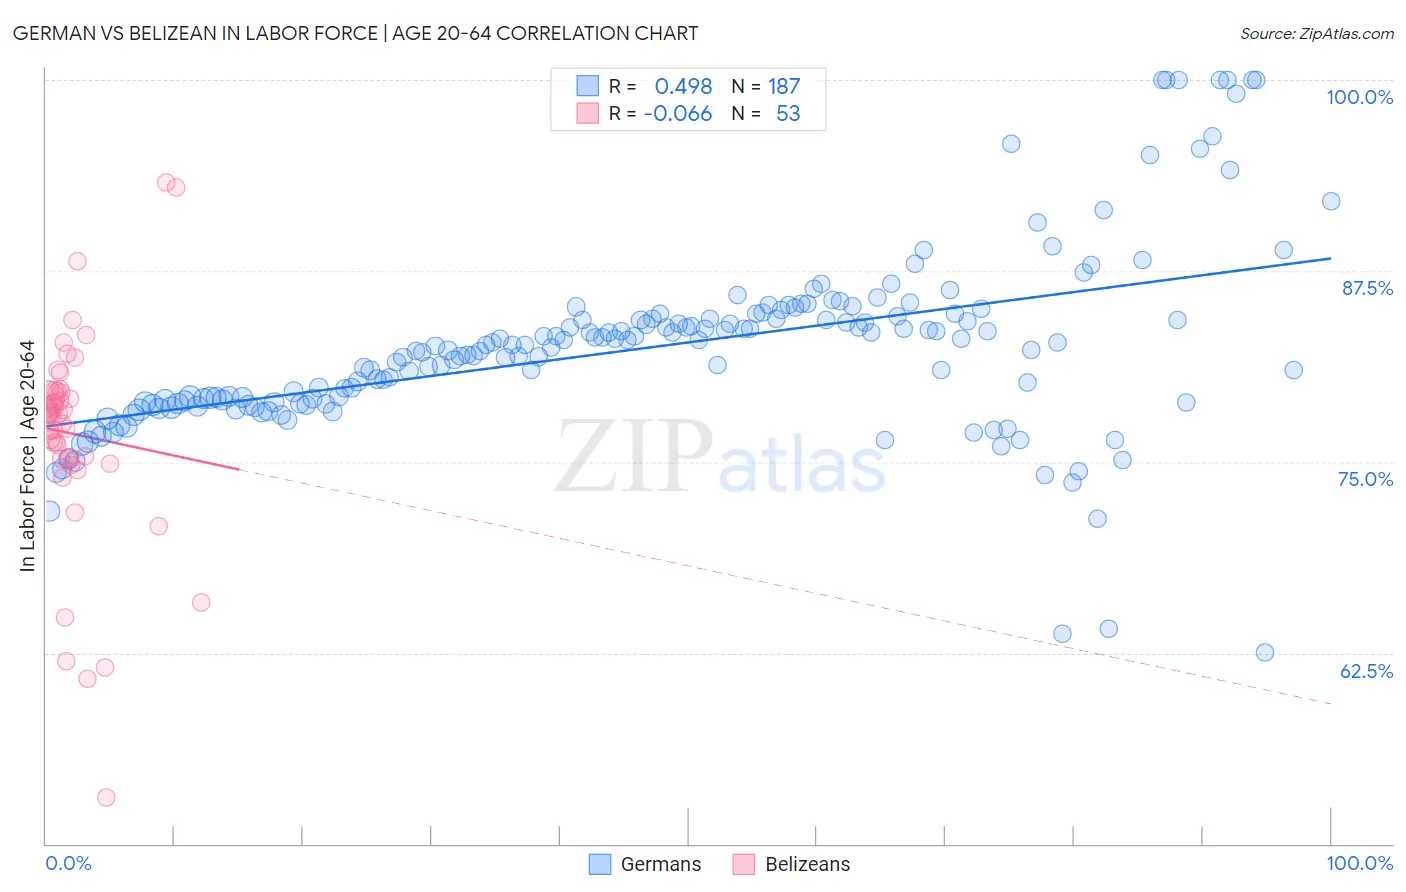
German vs Belizean In Labor Force | Age 20-64 Correlation Chart
The statistical analysis conducted on geographies consisting of 581,278,345 people shows a moderate positive correlation between the proportion of Germans and labor force participation rate among population between the ages 20 and 64 in the United States with a correlation coefficient (R) of 0.498 and weighted average of 79.7%. Similarly, the statistical analysis conducted on geographies consisting of 144,213,246 people shows a slight negative correlation between the proportion of Belizeans and labor force participation rate among population between the ages 20 and 64 in the United States with a correlation coefficient (R) of -0.066 and weighted average of 78.2%, a difference of 1.9%.
In Labor Force | Age 20-64 Correlation Summary
| Measurement | German | Belizean |
| Minimum | 62.5% | 53.0% |
| Maximum | 100.0% | 93.3% |
| Range | 37.5% | 40.3% |
| Mean | 82.5% | 76.8% |
| Median | 82.6% | 78.2% |
| Interquartile 25% (IQ1) | 78.9% | 75.2% |
| Interquartile 75% (IQ3) | 84.4% | 79.7% |
| Interquartile Range (IQR) | 5.5% | 4.5% |
| Standard Deviation (Sample) | 6.1% | 7.1% |
| Standard Deviation (Population) | 6.1% | 7.0% |
Similar Demographics by In Labor Force | Age 20-64
Demographics Similar to Germans by In Labor Force | Age 20-64
In terms of in labor force | age 20-64, the demographic groups most similar to Germans are Immigrants from Cuba (79.7%, a difference of 0.010%), Moroccan (79.7%, a difference of 0.010%), South African (79.7%, a difference of 0.010%), Immigrants from Costa Rica (79.7%, a difference of 0.010%), and Immigrants from Burma/Myanmar (79.7%, a difference of 0.010%).
| Demographics | Rating | Rank | In Labor Force | Age 20-64 |
| Immigrants | South Africa | 69.2 /100 | #155 | Good 79.7% |
| Senegalese | 69.1 /100 | #156 | Good 79.7% |
| Immigrants | China | 69.1 /100 | #157 | Good 79.7% |
| Austrians | 67.6 /100 | #158 | Good 79.7% |
| Immigrants | Cuba | 66.7 /100 | #159 | Good 79.7% |
| Moroccans | 66.7 /100 | #160 | Good 79.7% |
| South Africans | 66.2 /100 | #161 | Good 79.7% |
| Germans | 65.2 /100 | #162 | Good 79.7% |
| Immigrants | Costa Rica | 64.6 /100 | #163 | Good 79.7% |
| Immigrants | Burma/Myanmar | 64.4 /100 | #164 | Good 79.7% |
| Nigerians | 64.0 /100 | #165 | Good 79.7% |
| Okinawans | 62.7 /100 | #166 | Good 79.6% |
| Immigrants | Iraq | 62.0 /100 | #167 | Good 79.6% |
| Immigrants | Indonesia | 61.8 /100 | #168 | Good 79.6% |
| Laotians | 58.4 /100 | #169 | Average 79.6% |
Demographics Similar to Belizeans by In Labor Force | Age 20-64
In terms of in labor force | age 20-64, the demographic groups most similar to Belizeans are Immigrants from Dominica (78.1%, a difference of 0.040%), Mexican American Indian (78.2%, a difference of 0.050%), Immigrants from Bahamas (78.2%, a difference of 0.060%), Spanish (78.2%, a difference of 0.070%), and Puget Sound Salish (78.2%, a difference of 0.070%).
| Demographics | Rating | Rank | In Labor Force | Age 20-64 |
| Marshallese | 0.0 /100 | #272 | Tragic 78.3% |
| French American Indians | 0.0 /100 | #273 | Tragic 78.2% |
| Aleuts | 0.0 /100 | #274 | Tragic 78.2% |
| Spanish | 0.0 /100 | #275 | Tragic 78.2% |
| Puget Sound Salish | 0.0 /100 | #276 | Tragic 78.2% |
| Immigrants | Bahamas | 0.0 /100 | #277 | Tragic 78.2% |
| Mexican American Indians | 0.0 /100 | #278 | Tragic 78.2% |
| Belizeans | 0.0 /100 | #279 | Tragic 78.2% |
| Immigrants | Dominica | 0.0 /100 | #280 | Tragic 78.1% |
| Guyanese | 0.0 /100 | #281 | Tragic 78.1% |
| Immigrants | St. Vincent and the Grenadines | 0.0 /100 | #282 | Tragic 78.1% |
| Immigrants | Nonimmigrants | 0.0 /100 | #283 | Tragic 78.1% |
| Immigrants | Guyana | 0.0 /100 | #284 | Tragic 78.1% |
| Osage | 0.0 /100 | #285 | Tragic 78.0% |
| Immigrants | Belize | 0.0 /100 | #286 | Tragic 78.0% |