Filipino vs Greek In Labor Force | Age 16-19
COMPARE
Filipino
Greek
In Labor Force | Age 16-19
In Labor Force | Age 16-19 Comparison
Filipinos
Greeks
31.7%
IN LABOR FORCE | AGE 16-19
0.0/ 100
METRIC RATING
316th/ 347
METRIC RANK
38.9%
IN LABOR FORCE | AGE 16-19
99.3/ 100
METRIC RATING
97th/ 347
METRIC RANK
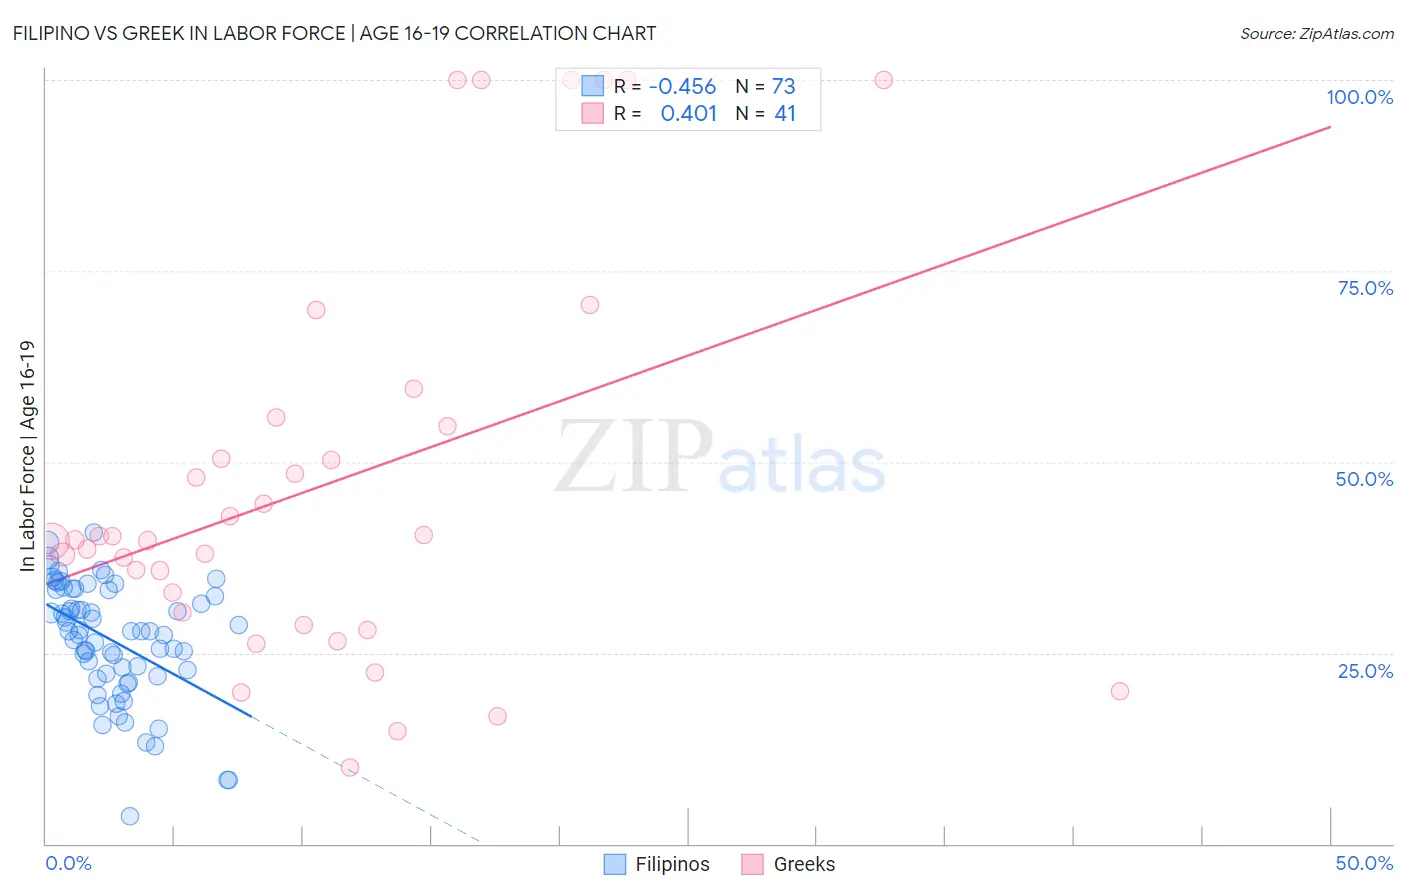
Filipino vs Greek In Labor Force | Age 16-19 Correlation Chart
The statistical analysis conducted on geographies consisting of 254,095,508 people shows a moderate negative correlation between the proportion of Filipinos and labor force participation rate among population between the ages 16 and 19 in the United States with a correlation coefficient (R) of -0.456 and weighted average of 31.7%. Similarly, the statistical analysis conducted on geographies consisting of 481,502,994 people shows a moderate positive correlation between the proportion of Greeks and labor force participation rate among population between the ages 16 and 19 in the United States with a correlation coefficient (R) of 0.401 and weighted average of 38.9%, a difference of 22.7%.
In Labor Force | Age 16-19 Correlation Summary
| Measurement | Filipino | Greek |
| Minimum | 3.5% | 10.0% |
| Maximum | 40.8% | 100.0% |
| Range | 37.3% | 90.0% |
| Mean | 26.6% | 47.2% |
| Median | 27.8% | 39.8% |
| Interquartile 25% (IQ1) | 22.1% | 29.5% |
| Interquartile 75% (IQ3) | 33.2% | 55.3% |
| Interquartile Range (IQR) | 11.1% | 25.8% |
| Standard Deviation (Sample) | 7.7% | 25.8% |
| Standard Deviation (Population) | 7.6% | 25.5% |
Similar Demographics by In Labor Force | Age 16-19
Demographics Similar to Filipinos by In Labor Force | Age 16-19
In terms of in labor force | age 16-19, the demographic groups most similar to Filipinos are Immigrants from West Indies (31.7%, a difference of 0.080%), Immigrants from Nicaragua (31.6%, a difference of 0.19%), Cuban (31.8%, a difference of 0.26%), Hopi (31.8%, a difference of 0.42%), and Immigrants from Belize (31.8%, a difference of 0.43%).
| Demographics | Rating | Rank | In Labor Force | Age 16-19 |
| Immigrants | Eastern Asia | 0.0 /100 | #309 | Tragic 32.0% |
| Immigrants | Iran | 0.0 /100 | #310 | Tragic 32.0% |
| Indians (Asian) | 0.0 /100 | #311 | Tragic 31.9% |
| Immigrants | Belize | 0.0 /100 | #312 | Tragic 31.8% |
| Hopi | 0.0 /100 | #313 | Tragic 31.8% |
| Cubans | 0.0 /100 | #314 | Tragic 31.8% |
| Immigrants | West Indies | 0.0 /100 | #315 | Tragic 31.7% |
| Filipinos | 0.0 /100 | #316 | Tragic 31.7% |
| Immigrants | Nicaragua | 0.0 /100 | #317 | Tragic 31.6% |
| Immigrants | Yemen | 0.0 /100 | #318 | Tragic 31.5% |
| Soviet Union | 0.0 /100 | #319 | Tragic 31.4% |
| Ecuadorians | 0.0 /100 | #320 | Tragic 31.4% |
| West Indians | 0.0 /100 | #321 | Tragic 31.3% |
| Tohono O'odham | 0.0 /100 | #322 | Tragic 31.3% |
| Immigrants | Caribbean | 0.0 /100 | #323 | Tragic 31.2% |
Demographics Similar to Greeks by In Labor Force | Age 16-19
In terms of in labor force | age 16-19, the demographic groups most similar to Greeks are Ugandan (38.9%, a difference of 0.010%), Immigrants from North Macedonia (38.9%, a difference of 0.030%), Latvian (38.9%, a difference of 0.040%), Immigrants from North America (38.9%, a difference of 0.070%), and Blackfeet (38.9%, a difference of 0.16%).
| Demographics | Rating | Rank | In Labor Force | Age 16-19 |
| Immigrants | Burma/Myanmar | 99.5 /100 | #90 | Exceptional 39.0% |
| Spanish Americans | 99.5 /100 | #91 | Exceptional 39.0% |
| Osage | 99.4 /100 | #92 | Exceptional 39.0% |
| Blackfeet | 99.4 /100 | #93 | Exceptional 38.9% |
| Immigrants | Canada | 99.4 /100 | #94 | Exceptional 38.9% |
| Immigrants | North America | 99.4 /100 | #95 | Exceptional 38.9% |
| Latvians | 99.4 /100 | #96 | Exceptional 38.9% |
| Greeks | 99.3 /100 | #97 | Exceptional 38.9% |
| Ugandans | 99.3 /100 | #98 | Exceptional 38.9% |
| Immigrants | North Macedonia | 99.3 /100 | #99 | Exceptional 38.9% |
| Immigrants | Thailand | 99.1 /100 | #100 | Exceptional 38.7% |
| Hmong | 99.1 /100 | #101 | Exceptional 38.7% |
| Zimbabweans | 99.1 /100 | #102 | Exceptional 38.7% |
| Immigrants | Cameroon | 99.0 /100 | #103 | Exceptional 38.7% |
| Immigrants | Eritrea | 99.0 /100 | #104 | Exceptional 38.7% |