Filipino vs Greek Associate's Degree
COMPARE
Filipino
Greek
Associate's Degree
Associate's Degree Comparison
Filipinos
Greeks
59.8%
ASSOCIATE'S DEGREE
100.0/ 100
METRIC RATING
1st/ 347
METRIC RANK
50.3%
ASSOCIATE'S DEGREE
98.9/ 100
METRIC RATING
82nd/ 347
METRIC RANK
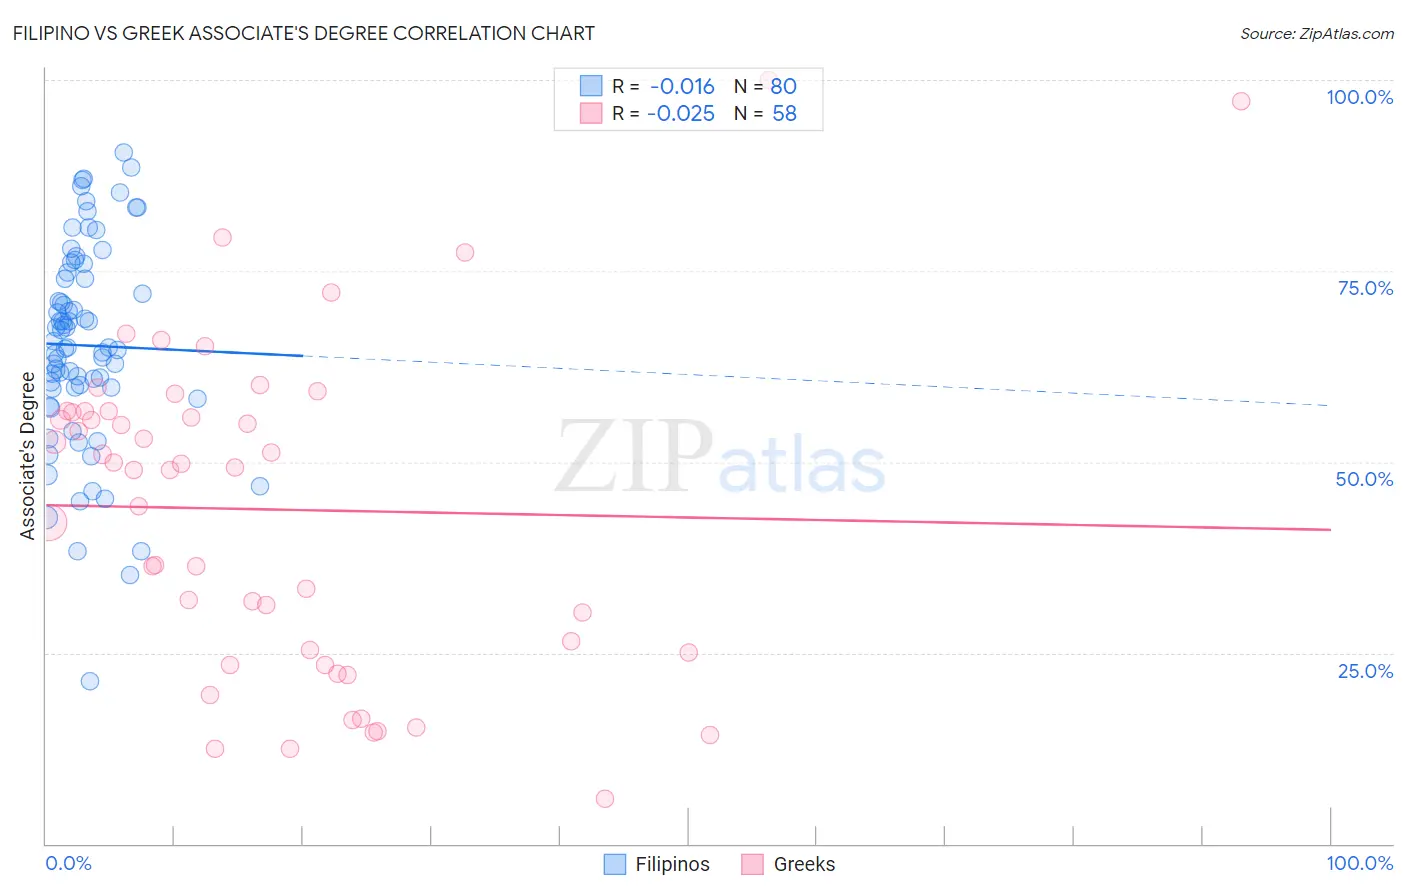
Filipino vs Greek Associate's Degree Correlation Chart
The statistical analysis conducted on geographies consisting of 254,337,502 people shows no correlation between the proportion of Filipinos and percentage of population with at least associate's degree education in the United States with a correlation coefficient (R) of -0.016 and weighted average of 59.8%. Similarly, the statistical analysis conducted on geographies consisting of 482,724,257 people shows no correlation between the proportion of Greeks and percentage of population with at least associate's degree education in the United States with a correlation coefficient (R) of -0.025 and weighted average of 50.3%, a difference of 18.9%.
Associate's Degree Correlation Summary
| Measurement | Filipino | Greek |
| Minimum | 21.2% | 5.9% |
| Maximum | 90.5% | 100.0% |
| Range | 69.3% | 94.1% |
| Mean | 65.3% | 43.8% |
| Median | 65.0% | 49.2% |
| Interquartile 25% (IQ1) | 59.7% | 25.0% |
| Interquartile 75% (IQ3) | 74.4% | 56.6% |
| Interquartile Range (IQR) | 14.7% | 31.6% |
| Standard Deviation (Sample) | 13.5% | 21.4% |
| Standard Deviation (Population) | 13.4% | 21.2% |
Similar Demographics by Associate's Degree
Demographics Similar to Filipinos by Associate's Degree
In terms of associate's degree, the demographic groups most similar to Filipinos are Immigrants from Singapore (58.9%, a difference of 1.5%), Immigrants from India (58.5%, a difference of 2.1%), Immigrants from Taiwan (58.4%, a difference of 2.4%), Iranian (58.2%, a difference of 2.8%), and Okinawan (57.7%, a difference of 3.7%).
| Demographics | Rating | Rank | Associate's Degree |
| Filipinos | 100.0 /100 | #1 | Exceptional 59.8% |
| Immigrants | Singapore | 100.0 /100 | #2 | Exceptional 58.9% |
| Immigrants | India | 100.0 /100 | #3 | Exceptional 58.5% |
| Immigrants | Taiwan | 100.0 /100 | #4 | Exceptional 58.4% |
| Iranians | 100.0 /100 | #5 | Exceptional 58.2% |
| Okinawans | 100.0 /100 | #6 | Exceptional 57.7% |
| Immigrants | Iran | 100.0 /100 | #7 | Exceptional 57.7% |
| Thais | 100.0 /100 | #8 | Exceptional 57.4% |
| Immigrants | Israel | 100.0 /100 | #9 | Exceptional 56.8% |
| Cypriots | 100.0 /100 | #10 | Exceptional 56.4% |
| Immigrants | Australia | 100.0 /100 | #11 | Exceptional 55.8% |
| Immigrants | South Central Asia | 100.0 /100 | #12 | Exceptional 55.7% |
| Immigrants | China | 100.0 /100 | #13 | Exceptional 55.5% |
| Immigrants | Hong Kong | 100.0 /100 | #14 | Exceptional 55.4% |
| Immigrants | Eastern Asia | 100.0 /100 | #15 | Exceptional 55.4% |
Demographics Similar to Greeks by Associate's Degree
In terms of associate's degree, the demographic groups most similar to Greeks are Immigrants from Uzbekistan (50.3%, a difference of 0.040%), Immigrants from Hungary (50.2%, a difference of 0.060%), Immigrants from Egypt (50.2%, a difference of 0.11%), Immigrants from Croatia (50.2%, a difference of 0.12%), and Maltese (50.4%, a difference of 0.23%).
| Demographics | Rating | Rank | Associate's Degree |
| Immigrants | Scotland | 99.3 /100 | #75 | Exceptional 50.6% |
| Immigrants | Zimbabwe | 99.2 /100 | #76 | Exceptional 50.5% |
| Immigrants | Lebanon | 99.1 /100 | #77 | Exceptional 50.5% |
| Immigrants | Eastern Europe | 99.1 /100 | #78 | Exceptional 50.5% |
| Ethiopians | 99.1 /100 | #79 | Exceptional 50.4% |
| Armenians | 99.1 /100 | #80 | Exceptional 50.4% |
| Maltese | 99.1 /100 | #81 | Exceptional 50.4% |
| Greeks | 98.9 /100 | #82 | Exceptional 50.3% |
| Immigrants | Uzbekistan | 98.9 /100 | #83 | Exceptional 50.3% |
| Immigrants | Hungary | 98.9 /100 | #84 | Exceptional 50.2% |
| Immigrants | Egypt | 98.9 /100 | #85 | Exceptional 50.2% |
| Immigrants | Croatia | 98.9 /100 | #86 | Exceptional 50.2% |
| Immigrants | Moldova | 98.8 /100 | #87 | Exceptional 50.2% |
| Immigrants | Canada | 98.7 /100 | #88 | Exceptional 50.1% |
| Immigrants | Western Europe | 98.7 /100 | #89 | Exceptional 50.1% |