Filipino vs Immigrants from Cuba In Labor Force | Age 16-19
COMPARE
Filipino
Immigrants from Cuba
In Labor Force | Age 16-19
In Labor Force | Age 16-19 Comparison
Filipinos
Immigrants from Cuba
31.7%
IN LABOR FORCE | AGE 16-19
0.0/ 100
METRIC RATING
316th/ 347
METRIC RANK
30.2%
IN LABOR FORCE | AGE 16-19
0.0/ 100
METRIC RATING
335th/ 347
METRIC RANK
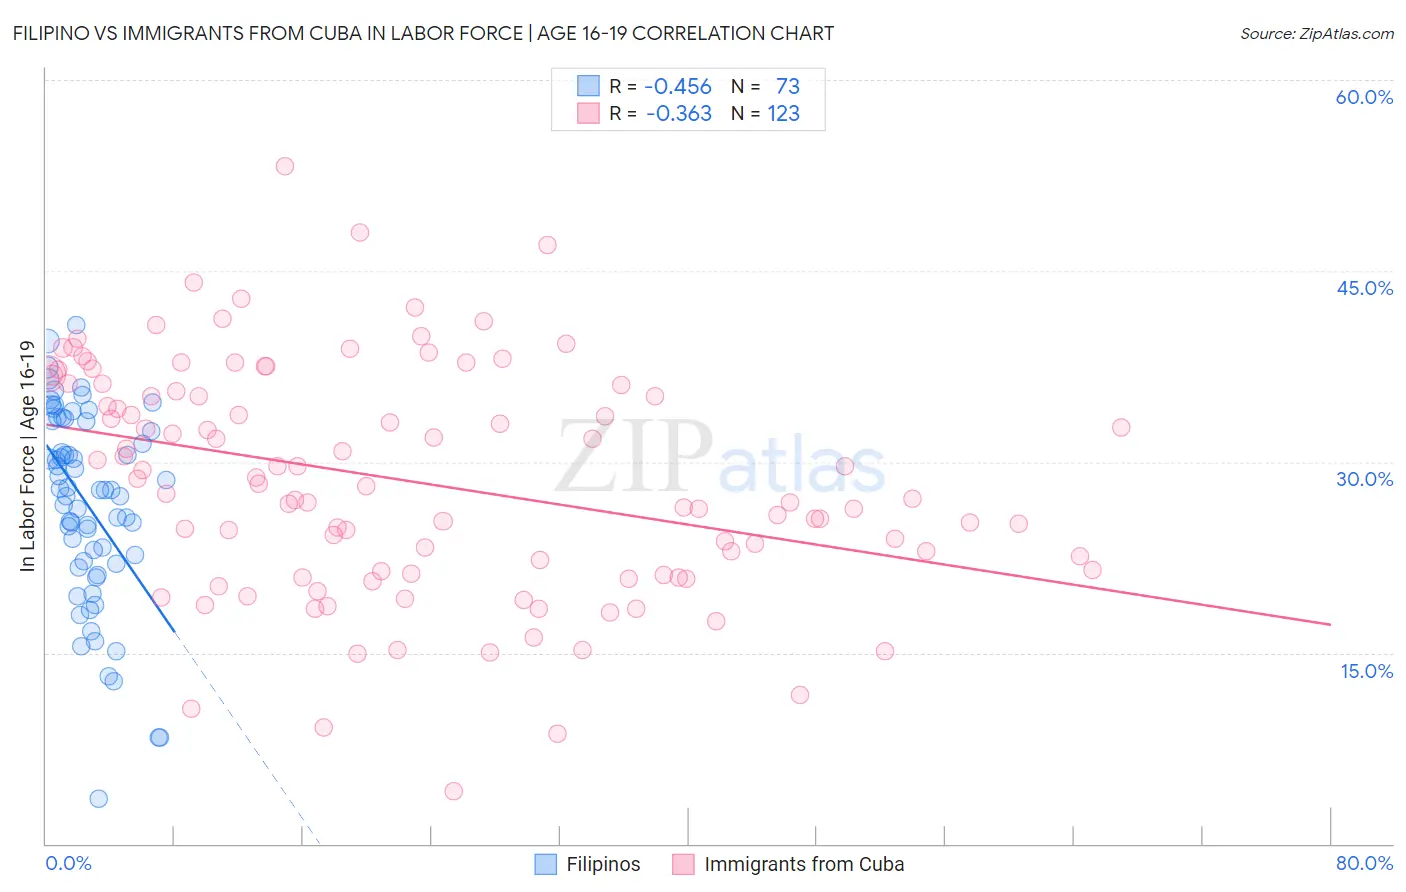
Filipino vs Immigrants from Cuba In Labor Force | Age 16-19 Correlation Chart
The statistical analysis conducted on geographies consisting of 254,095,508 people shows a moderate negative correlation between the proportion of Filipinos and labor force participation rate among population between the ages 16 and 19 in the United States with a correlation coefficient (R) of -0.456 and weighted average of 31.7%. Similarly, the statistical analysis conducted on geographies consisting of 325,558,601 people shows a mild negative correlation between the proportion of Immigrants from Cuba and labor force participation rate among population between the ages 16 and 19 in the United States with a correlation coefficient (R) of -0.363 and weighted average of 30.2%, a difference of 4.8%.
In Labor Force | Age 16-19 Correlation Summary
| Measurement | Filipino | Immigrants from Cuba |
| Minimum | 3.5% | 4.1% |
| Maximum | 40.8% | 53.2% |
| Range | 37.3% | 49.1% |
| Mean | 26.6% | 28.4% |
| Median | 27.8% | 28.1% |
| Interquartile 25% (IQ1) | 22.1% | 21.2% |
| Interquartile 75% (IQ3) | 33.2% | 36.0% |
| Interquartile Range (IQR) | 11.1% | 14.8% |
| Standard Deviation (Sample) | 7.7% | 9.1% |
| Standard Deviation (Population) | 7.6% | 9.0% |
Demographics Similar to Filipinos and Immigrants from Cuba by In Labor Force | Age 16-19
In terms of in labor force | age 16-19, the demographic groups most similar to Filipinos are Immigrants from West Indies (31.7%, a difference of 0.080%), Immigrants from Nicaragua (31.6%, a difference of 0.19%), Immigrants from Yemen (31.5%, a difference of 0.53%), Soviet Union (31.4%, a difference of 0.86%), and Ecuadorian (31.4%, a difference of 0.92%). Similarly, the demographic groups most similar to Immigrants from Cuba are Puerto Rican (30.3%, a difference of 0.33%), Immigrants from Hong Kong (30.5%, a difference of 0.75%), Immigrants from Israel (30.5%, a difference of 0.77%), Trinidadian and Tobagonian (30.9%, a difference of 2.2%), and Lumbee (31.0%, a difference of 2.4%).
| Demographics | Rating | Rank | In Labor Force | Age 16-19 |
| Immigrants | West Indies | 0.0 /100 | #315 | Tragic 31.7% |
| Filipinos | 0.0 /100 | #316 | Tragic 31.7% |
| Immigrants | Nicaragua | 0.0 /100 | #317 | Tragic 31.6% |
| Immigrants | Yemen | 0.0 /100 | #318 | Tragic 31.5% |
| Soviet Union | 0.0 /100 | #319 | Tragic 31.4% |
| Ecuadorians | 0.0 /100 | #320 | Tragic 31.4% |
| West Indians | 0.0 /100 | #321 | Tragic 31.3% |
| Tohono O'odham | 0.0 /100 | #322 | Tragic 31.3% |
| Immigrants | Caribbean | 0.0 /100 | #323 | Tragic 31.2% |
| Dominicans | 0.0 /100 | #324 | Tragic 31.2% |
| Immigrants | China | 0.0 /100 | #325 | Tragic 31.1% |
| Immigrants | Dominican Republic | 0.0 /100 | #326 | Tragic 31.1% |
| Immigrants | Taiwan | 0.0 /100 | #327 | Tragic 31.0% |
| Immigrants | Ecuador | 0.0 /100 | #328 | Tragic 31.0% |
| Barbadians | 0.0 /100 | #329 | Tragic 31.0% |
| Lumbee | 0.0 /100 | #330 | Tragic 31.0% |
| Trinidadians and Tobagonians | 0.0 /100 | #331 | Tragic 30.9% |
| Immigrants | Israel | 0.0 /100 | #332 | Tragic 30.5% |
| Immigrants | Hong Kong | 0.0 /100 | #333 | Tragic 30.5% |
| Puerto Ricans | 0.0 /100 | #334 | Tragic 30.3% |
| Immigrants | Cuba | 0.0 /100 | #335 | Tragic 30.2% |