Immigrants from Brazil vs Greek In Labor Force | Age 16-19
COMPARE
Immigrants from Brazil
Greek
In Labor Force | Age 16-19
In Labor Force | Age 16-19 Comparison
Immigrants from Brazil
Greeks
37.1%
IN LABOR FORCE | AGE 16-19
76.5/ 100
METRIC RATING
157th/ 347
METRIC RANK
38.9%
IN LABOR FORCE | AGE 16-19
99.3/ 100
METRIC RATING
97th/ 347
METRIC RANK
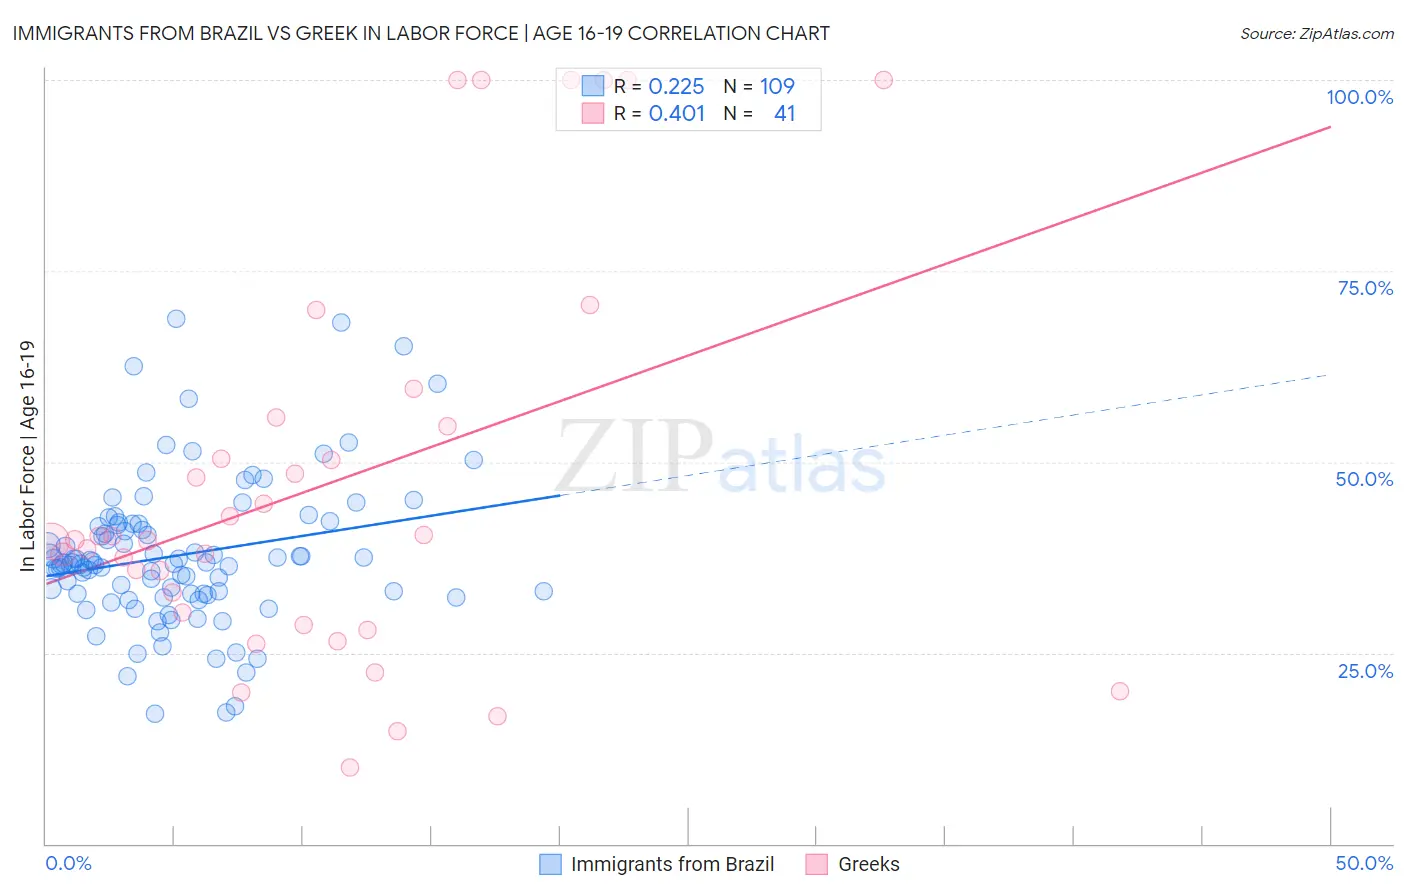
Immigrants from Brazil vs Greek In Labor Force | Age 16-19 Correlation Chart
The statistical analysis conducted on geographies consisting of 342,618,647 people shows a weak positive correlation between the proportion of Immigrants from Brazil and labor force participation rate among population between the ages 16 and 19 in the United States with a correlation coefficient (R) of 0.225 and weighted average of 37.1%. Similarly, the statistical analysis conducted on geographies consisting of 481,502,994 people shows a moderate positive correlation between the proportion of Greeks and labor force participation rate among population between the ages 16 and 19 in the United States with a correlation coefficient (R) of 0.401 and weighted average of 38.9%, a difference of 4.7%.
In Labor Force | Age 16-19 Correlation Summary
| Measurement | Immigrants from Brazil | Greek |
| Minimum | 17.1% | 10.0% |
| Maximum | 68.8% | 100.0% |
| Range | 51.7% | 90.0% |
| Mean | 37.8% | 47.2% |
| Median | 36.7% | 39.8% |
| Interquartile 25% (IQ1) | 32.7% | 29.5% |
| Interquartile 75% (IQ3) | 41.8% | 55.3% |
| Interquartile Range (IQR) | 9.1% | 25.8% |
| Standard Deviation (Sample) | 9.5% | 25.8% |
| Standard Deviation (Population) | 9.5% | 25.5% |
Similar Demographics by In Labor Force | Age 16-19
Demographics Similar to Immigrants from Brazil by In Labor Force | Age 16-19
In terms of in labor force | age 16-19, the demographic groups most similar to Immigrants from Brazil are Ute (37.1%, a difference of 0.050%), Yaqui (37.1%, a difference of 0.14%), Immigrants from Saudi Arabia (37.0%, a difference of 0.17%), Kiowa (37.2%, a difference of 0.29%), and Immigrants from Lithuania (37.2%, a difference of 0.31%).
| Demographics | Rating | Rank | In Labor Force | Age 16-19 |
| Tsimshian | 84.7 /100 | #150 | Excellent 37.4% |
| Immigrants | Poland | 84.4 /100 | #151 | Excellent 37.3% |
| Immigrants | Sierra Leone | 83.6 /100 | #152 | Excellent 37.3% |
| Arapaho | 81.8 /100 | #153 | Excellent 37.3% |
| Immigrants | Bulgaria | 81.6 /100 | #154 | Excellent 37.3% |
| Immigrants | Lithuania | 80.7 /100 | #155 | Excellent 37.2% |
| Kiowa | 80.4 /100 | #156 | Excellent 37.2% |
| Immigrants | Brazil | 76.5 /100 | #157 | Good 37.1% |
| Ute | 75.7 /100 | #158 | Good 37.1% |
| Yaqui | 74.4 /100 | #159 | Good 37.1% |
| Immigrants | Saudi Arabia | 73.9 /100 | #160 | Good 37.0% |
| Cambodians | 71.5 /100 | #161 | Good 37.0% |
| Immigrants | Jordan | 69.5 /100 | #162 | Good 36.9% |
| Bermudans | 69.3 /100 | #163 | Good 36.9% |
| Immigrants | Kuwait | 68.9 /100 | #164 | Good 36.9% |
Demographics Similar to Greeks by In Labor Force | Age 16-19
In terms of in labor force | age 16-19, the demographic groups most similar to Greeks are Ugandan (38.9%, a difference of 0.010%), Immigrants from North Macedonia (38.9%, a difference of 0.030%), Latvian (38.9%, a difference of 0.040%), Immigrants from North America (38.9%, a difference of 0.070%), and Blackfeet (38.9%, a difference of 0.16%).
| Demographics | Rating | Rank | In Labor Force | Age 16-19 |
| Immigrants | Burma/Myanmar | 99.5 /100 | #90 | Exceptional 39.0% |
| Spanish Americans | 99.5 /100 | #91 | Exceptional 39.0% |
| Osage | 99.4 /100 | #92 | Exceptional 39.0% |
| Blackfeet | 99.4 /100 | #93 | Exceptional 38.9% |
| Immigrants | Canada | 99.4 /100 | #94 | Exceptional 38.9% |
| Immigrants | North America | 99.4 /100 | #95 | Exceptional 38.9% |
| Latvians | 99.4 /100 | #96 | Exceptional 38.9% |
| Greeks | 99.3 /100 | #97 | Exceptional 38.9% |
| Ugandans | 99.3 /100 | #98 | Exceptional 38.9% |
| Immigrants | North Macedonia | 99.3 /100 | #99 | Exceptional 38.9% |
| Immigrants | Thailand | 99.1 /100 | #100 | Exceptional 38.7% |
| Hmong | 99.1 /100 | #101 | Exceptional 38.7% |
| Zimbabweans | 99.1 /100 | #102 | Exceptional 38.7% |
| Immigrants | Cameroon | 99.0 /100 | #103 | Exceptional 38.7% |
| Immigrants | Eritrea | 99.0 /100 | #104 | Exceptional 38.7% |