Immigrants from Eastern Europe vs Greek In Labor Force | Age 16-19
COMPARE
Immigrants from Eastern Europe
Greek
In Labor Force | Age 16-19
In Labor Force | Age 16-19 Comparison
Immigrants from Eastern Europe
Greeks
35.8%
IN LABOR FORCE | AGE 16-19
14.5/ 100
METRIC RATING
207th/ 347
METRIC RANK
38.9%
IN LABOR FORCE | AGE 16-19
99.3/ 100
METRIC RATING
97th/ 347
METRIC RANK
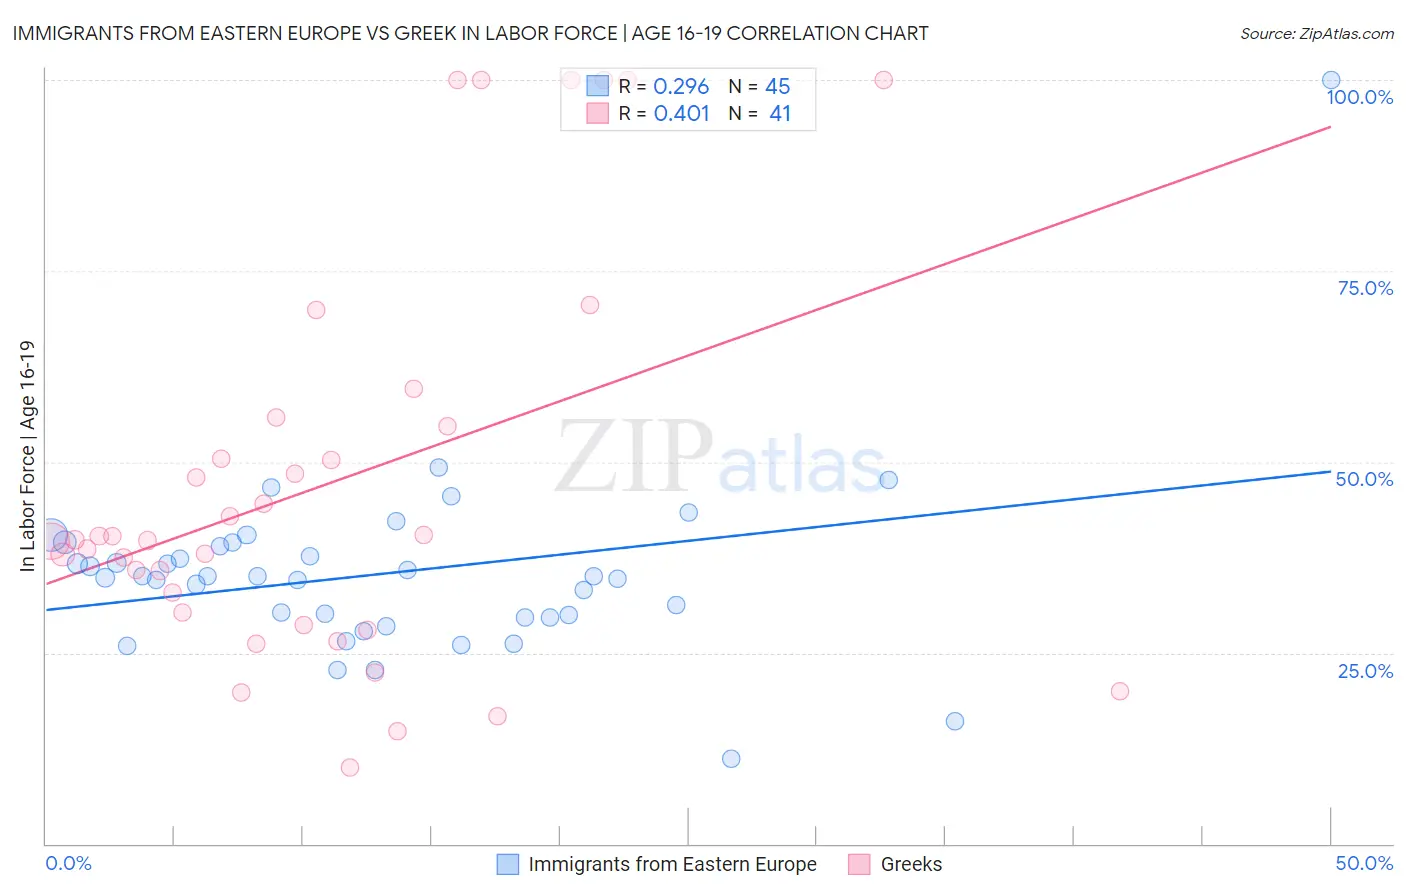
Immigrants from Eastern Europe vs Greek In Labor Force | Age 16-19 Correlation Chart
The statistical analysis conducted on geographies consisting of 474,546,835 people shows a weak positive correlation between the proportion of Immigrants from Eastern Europe and labor force participation rate among population between the ages 16 and 19 in the United States with a correlation coefficient (R) of 0.296 and weighted average of 35.8%. Similarly, the statistical analysis conducted on geographies consisting of 481,502,994 people shows a moderate positive correlation between the proportion of Greeks and labor force participation rate among population between the ages 16 and 19 in the United States with a correlation coefficient (R) of 0.401 and weighted average of 38.9%, a difference of 8.7%.
In Labor Force | Age 16-19 Correlation Summary
| Measurement | Immigrants from Eastern Europe | Greek |
| Minimum | 11.2% | 10.0% |
| Maximum | 100.0% | 100.0% |
| Range | 88.8% | 90.0% |
| Mean | 35.4% | 47.2% |
| Median | 35.0% | 39.8% |
| Interquartile 25% (IQ1) | 29.6% | 29.5% |
| Interquartile 75% (IQ3) | 39.2% | 55.3% |
| Interquartile Range (IQR) | 9.6% | 25.8% |
| Standard Deviation (Sample) | 12.5% | 25.8% |
| Standard Deviation (Population) | 12.4% | 25.5% |
Similar Demographics by In Labor Force | Age 16-19
Demographics Similar to Immigrants from Eastern Europe by In Labor Force | Age 16-19
In terms of in labor force | age 16-19, the demographic groups most similar to Immigrants from Eastern Europe are South American Indian (35.8%, a difference of 0.020%), Chilean (35.8%, a difference of 0.020%), Immigrants from Albania (35.8%, a difference of 0.050%), Korean (35.7%, a difference of 0.12%), and Moroccan (35.7%, a difference of 0.19%).
| Demographics | Rating | Rank | In Labor Force | Age 16-19 |
| Immigrants | Sweden | 18.8 /100 | #200 | Poor 35.9% |
| Alsatians | 17.5 /100 | #201 | Poor 35.9% |
| Senegalese | 17.4 /100 | #202 | Poor 35.9% |
| Immigrants | Nigeria | 16.8 /100 | #203 | Poor 35.8% |
| Immigrants | Albania | 15.0 /100 | #204 | Poor 35.8% |
| South American Indians | 14.6 /100 | #205 | Poor 35.8% |
| Chileans | 14.6 /100 | #206 | Poor 35.8% |
| Immigrants | Eastern Europe | 14.5 /100 | #207 | Poor 35.8% |
| Koreans | 13.3 /100 | #208 | Poor 35.7% |
| Moroccans | 12.7 /100 | #209 | Poor 35.7% |
| Immigrants | Switzerland | 11.9 /100 | #210 | Poor 35.6% |
| Mexicans | 11.9 /100 | #211 | Poor 35.6% |
| Houma | 11.0 /100 | #212 | Poor 35.6% |
| Immigrants | Bolivia | 11.0 /100 | #213 | Poor 35.6% |
| Apache | 11.0 /100 | #214 | Poor 35.6% |
Demographics Similar to Greeks by In Labor Force | Age 16-19
In terms of in labor force | age 16-19, the demographic groups most similar to Greeks are Ugandan (38.9%, a difference of 0.010%), Immigrants from North Macedonia (38.9%, a difference of 0.030%), Latvian (38.9%, a difference of 0.040%), Immigrants from North America (38.9%, a difference of 0.070%), and Blackfeet (38.9%, a difference of 0.16%).
| Demographics | Rating | Rank | In Labor Force | Age 16-19 |
| Immigrants | Burma/Myanmar | 99.5 /100 | #90 | Exceptional 39.0% |
| Spanish Americans | 99.5 /100 | #91 | Exceptional 39.0% |
| Osage | 99.4 /100 | #92 | Exceptional 39.0% |
| Blackfeet | 99.4 /100 | #93 | Exceptional 38.9% |
| Immigrants | Canada | 99.4 /100 | #94 | Exceptional 38.9% |
| Immigrants | North America | 99.4 /100 | #95 | Exceptional 38.9% |
| Latvians | 99.4 /100 | #96 | Exceptional 38.9% |
| Greeks | 99.3 /100 | #97 | Exceptional 38.9% |
| Ugandans | 99.3 /100 | #98 | Exceptional 38.9% |
| Immigrants | North Macedonia | 99.3 /100 | #99 | Exceptional 38.9% |
| Immigrants | Thailand | 99.1 /100 | #100 | Exceptional 38.7% |
| Hmong | 99.1 /100 | #101 | Exceptional 38.7% |
| Zimbabweans | 99.1 /100 | #102 | Exceptional 38.7% |
| Immigrants | Cameroon | 99.0 /100 | #103 | Exceptional 38.7% |
| Immigrants | Eritrea | 99.0 /100 | #104 | Exceptional 38.7% |