Filipino vs Asian In Labor Force | Age 16-19
COMPARE
Filipino
Asian
In Labor Force | Age 16-19
In Labor Force | Age 16-19 Comparison
Filipinos
Asians
31.7%
IN LABOR FORCE | AGE 16-19
0.0/ 100
METRIC RATING
316th/ 347
METRIC RANK
34.1%
IN LABOR FORCE | AGE 16-19
0.4/ 100
METRIC RATING
272nd/ 347
METRIC RANK
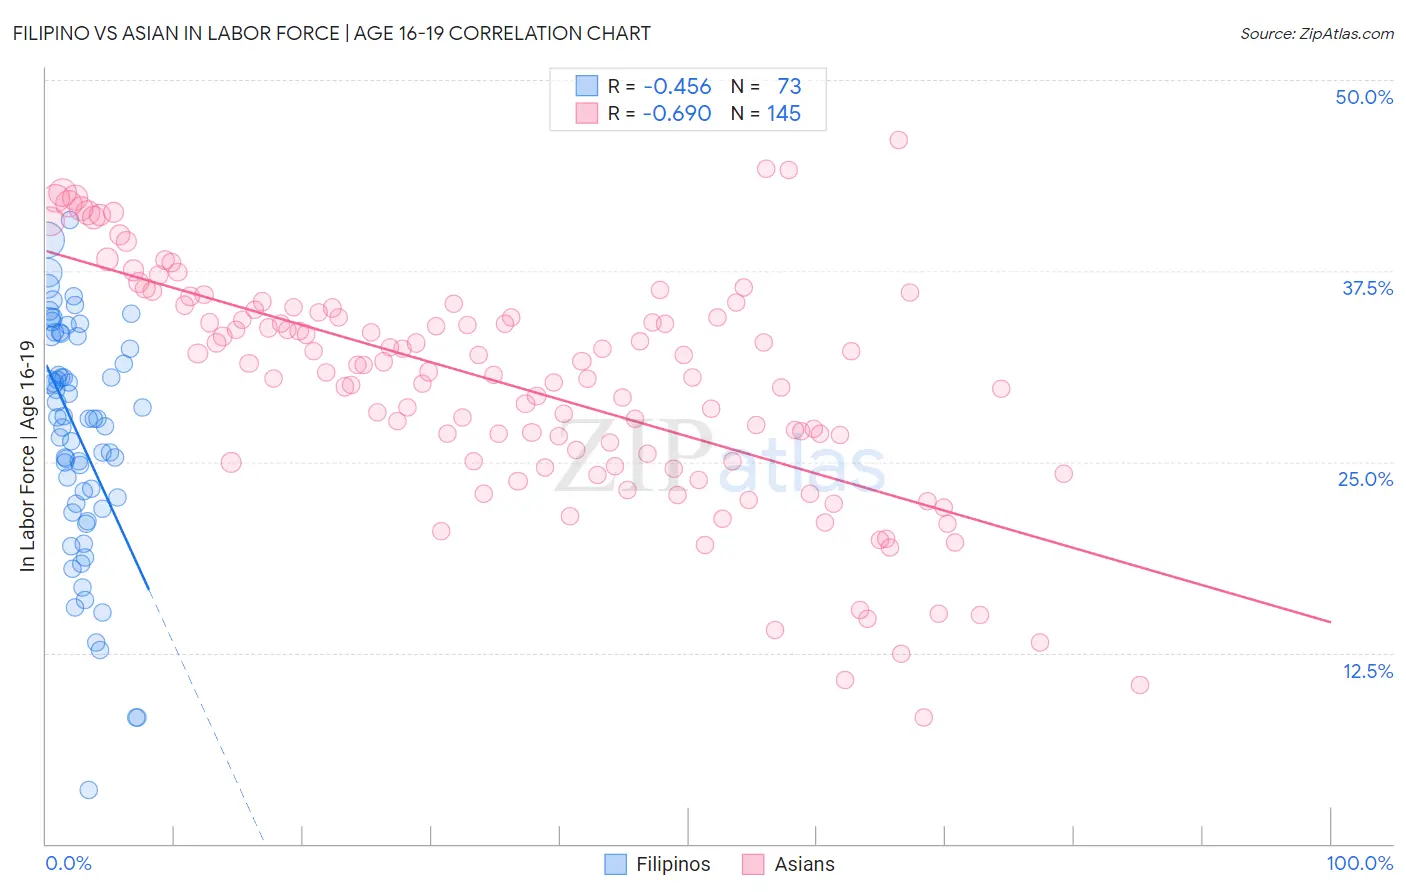
Filipino vs Asian In Labor Force | Age 16-19 Correlation Chart
The statistical analysis conducted on geographies consisting of 254,095,508 people shows a moderate negative correlation between the proportion of Filipinos and labor force participation rate among population between the ages 16 and 19 in the United States with a correlation coefficient (R) of -0.456 and weighted average of 31.7%. Similarly, the statistical analysis conducted on geographies consisting of 548,440,716 people shows a significant negative correlation between the proportion of Asians and labor force participation rate among population between the ages 16 and 19 in the United States with a correlation coefficient (R) of -0.690 and weighted average of 34.1%, a difference of 7.5%.
In Labor Force | Age 16-19 Correlation Summary
| Measurement | Filipino | Asian |
| Minimum | 3.5% | 8.3% |
| Maximum | 40.8% | 46.1% |
| Range | 37.3% | 37.8% |
| Mean | 26.6% | 29.9% |
| Median | 27.8% | 30.9% |
| Interquartile 25% (IQ1) | 22.1% | 25.0% |
| Interquartile 75% (IQ3) | 33.2% | 34.9% |
| Interquartile Range (IQR) | 11.1% | 9.9% |
| Standard Deviation (Sample) | 7.7% | 7.6% |
| Standard Deviation (Population) | 7.6% | 7.6% |
Similar Demographics by In Labor Force | Age 16-19
Demographics Similar to Filipinos by In Labor Force | Age 16-19
In terms of in labor force | age 16-19, the demographic groups most similar to Filipinos are Immigrants from West Indies (31.7%, a difference of 0.080%), Immigrants from Nicaragua (31.6%, a difference of 0.19%), Cuban (31.8%, a difference of 0.26%), Hopi (31.8%, a difference of 0.42%), and Immigrants from Belize (31.8%, a difference of 0.43%).
| Demographics | Rating | Rank | In Labor Force | Age 16-19 |
| Immigrants | Eastern Asia | 0.0 /100 | #309 | Tragic 32.0% |
| Immigrants | Iran | 0.0 /100 | #310 | Tragic 32.0% |
| Indians (Asian) | 0.0 /100 | #311 | Tragic 31.9% |
| Immigrants | Belize | 0.0 /100 | #312 | Tragic 31.8% |
| Hopi | 0.0 /100 | #313 | Tragic 31.8% |
| Cubans | 0.0 /100 | #314 | Tragic 31.8% |
| Immigrants | West Indies | 0.0 /100 | #315 | Tragic 31.7% |
| Filipinos | 0.0 /100 | #316 | Tragic 31.7% |
| Immigrants | Nicaragua | 0.0 /100 | #317 | Tragic 31.6% |
| Immigrants | Yemen | 0.0 /100 | #318 | Tragic 31.5% |
| Soviet Union | 0.0 /100 | #319 | Tragic 31.4% |
| Ecuadorians | 0.0 /100 | #320 | Tragic 31.4% |
| West Indians | 0.0 /100 | #321 | Tragic 31.3% |
| Tohono O'odham | 0.0 /100 | #322 | Tragic 31.3% |
| Immigrants | Caribbean | 0.0 /100 | #323 | Tragic 31.2% |
Demographics Similar to Asians by In Labor Force | Age 16-19
In terms of in labor force | age 16-19, the demographic groups most similar to Asians are Immigrants from Russia (34.1%, a difference of 0.030%), Central American Indian (34.1%, a difference of 0.030%), Pima (34.1%, a difference of 0.070%), Immigrants from Asia (34.1%, a difference of 0.16%), and Immigrants from Panama (34.0%, a difference of 0.22%).
| Demographics | Rating | Rank | In Labor Force | Age 16-19 |
| Immigrants | El Salvador | 0.7 /100 | #265 | Tragic 34.3% |
| Immigrants | Malaysia | 0.7 /100 | #266 | Tragic 34.3% |
| Immigrants | Peru | 0.5 /100 | #267 | Tragic 34.2% |
| Immigrants | Asia | 0.5 /100 | #268 | Tragic 34.1% |
| Pima | 0.5 /100 | #269 | Tragic 34.1% |
| Immigrants | Russia | 0.4 /100 | #270 | Tragic 34.1% |
| Central American Indians | 0.4 /100 | #271 | Tragic 34.1% |
| Asians | 0.4 /100 | #272 | Tragic 34.1% |
| Immigrants | Panama | 0.4 /100 | #273 | Tragic 34.0% |
| Venezuelans | 0.3 /100 | #274 | Tragic 34.0% |
| Immigrants | Fiji | 0.3 /100 | #275 | Tragic 33.9% |
| Immigrants | Latin America | 0.3 /100 | #276 | Tragic 33.9% |
| Menominee | 0.3 /100 | #277 | Tragic 33.9% |
| Colombians | 0.3 /100 | #278 | Tragic 33.8% |
| Paraguayans | 0.3 /100 | #279 | Tragic 33.8% |