Portuguese vs Greek In Labor Force | Age 16-19
COMPARE
Portuguese
Greek
In Labor Force | Age 16-19
In Labor Force | Age 16-19 Comparison
Portuguese
Greeks
40.0%
IN LABOR FORCE | AGE 16-19
99.9/ 100
METRIC RATING
70th/ 347
METRIC RANK
38.9%
IN LABOR FORCE | AGE 16-19
99.3/ 100
METRIC RATING
97th/ 347
METRIC RANK
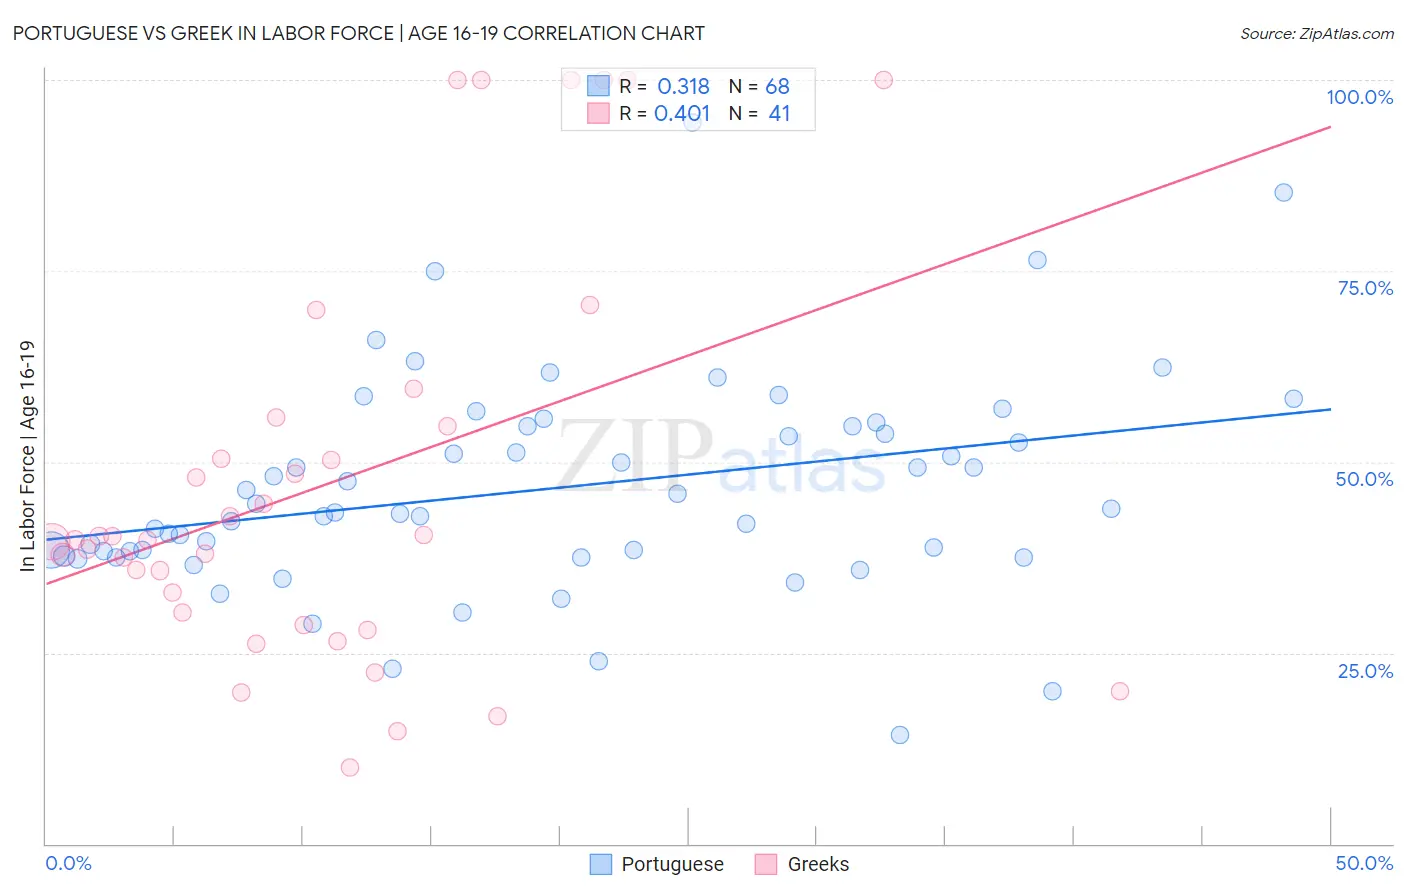
Portuguese vs Greek In Labor Force | Age 16-19 Correlation Chart
The statistical analysis conducted on geographies consisting of 449,088,849 people shows a mild positive correlation between the proportion of Portuguese and labor force participation rate among population between the ages 16 and 19 in the United States with a correlation coefficient (R) of 0.318 and weighted average of 40.0%. Similarly, the statistical analysis conducted on geographies consisting of 481,502,994 people shows a moderate positive correlation between the proportion of Greeks and labor force participation rate among population between the ages 16 and 19 in the United States with a correlation coefficient (R) of 0.401 and weighted average of 38.9%, a difference of 2.9%.
In Labor Force | Age 16-19 Correlation Summary
| Measurement | Portuguese | Greek |
| Minimum | 14.2% | 10.0% |
| Maximum | 94.4% | 100.0% |
| Range | 80.2% | 90.0% |
| Mean | 46.5% | 47.2% |
| Median | 43.6% | 39.8% |
| Interquartile 25% (IQ1) | 38.0% | 29.5% |
| Interquartile 75% (IQ3) | 54.6% | 55.3% |
| Interquartile Range (IQR) | 16.7% | 25.8% |
| Standard Deviation (Sample) | 14.1% | 25.8% |
| Standard Deviation (Population) | 14.0% | 25.5% |
Similar Demographics by In Labor Force | Age 16-19
Demographics Similar to Portuguese by In Labor Force | Age 16-19
In terms of in labor force | age 16-19, the demographic groups most similar to Portuguese are Potawatomi (40.0%, a difference of 0.050%), Italian (40.1%, a difference of 0.12%), Serbian (39.9%, a difference of 0.17%), Iroquois (39.9%, a difference of 0.17%), and Canadian (40.1%, a difference of 0.18%).
| Demographics | Rating | Rank | In Labor Force | Age 16-19 |
| Northern Europeans | 100.0 /100 | #63 | Exceptional 40.2% |
| Immigrants | Micronesia | 100.0 /100 | #64 | Exceptional 40.2% |
| Kenyans | 100.0 /100 | #65 | Exceptional 40.1% |
| Immigrants | Nonimmigrants | 100.0 /100 | #66 | Exceptional 40.1% |
| Canadians | 100.0 /100 | #67 | Exceptional 40.1% |
| Italians | 99.9 /100 | #68 | Exceptional 40.1% |
| Potawatomi | 99.9 /100 | #69 | Exceptional 40.0% |
| Portuguese | 99.9 /100 | #70 | Exceptional 40.0% |
| Serbians | 99.9 /100 | #71 | Exceptional 39.9% |
| Iroquois | 99.9 /100 | #72 | Exceptional 39.9% |
| Immigrants | Middle Africa | 99.9 /100 | #73 | Exceptional 39.9% |
| Hungarians | 99.9 /100 | #74 | Exceptional 39.8% |
| French American Indians | 99.9 /100 | #75 | Exceptional 39.8% |
| Malaysians | 99.9 /100 | #76 | Exceptional 39.7% |
| Immigrants | Portugal | 99.9 /100 | #77 | Exceptional 39.7% |
Demographics Similar to Greeks by In Labor Force | Age 16-19
In terms of in labor force | age 16-19, the demographic groups most similar to Greeks are Ugandan (38.9%, a difference of 0.010%), Immigrants from North Macedonia (38.9%, a difference of 0.030%), Latvian (38.9%, a difference of 0.040%), Immigrants from North America (38.9%, a difference of 0.070%), and Blackfeet (38.9%, a difference of 0.16%).
| Demographics | Rating | Rank | In Labor Force | Age 16-19 |
| Immigrants | Burma/Myanmar | 99.5 /100 | #90 | Exceptional 39.0% |
| Spanish Americans | 99.5 /100 | #91 | Exceptional 39.0% |
| Osage | 99.4 /100 | #92 | Exceptional 39.0% |
| Blackfeet | 99.4 /100 | #93 | Exceptional 38.9% |
| Immigrants | Canada | 99.4 /100 | #94 | Exceptional 38.9% |
| Immigrants | North America | 99.4 /100 | #95 | Exceptional 38.9% |
| Latvians | 99.4 /100 | #96 | Exceptional 38.9% |
| Greeks | 99.3 /100 | #97 | Exceptional 38.9% |
| Ugandans | 99.3 /100 | #98 | Exceptional 38.9% |
| Immigrants | North Macedonia | 99.3 /100 | #99 | Exceptional 38.9% |
| Immigrants | Thailand | 99.1 /100 | #100 | Exceptional 38.7% |
| Hmong | 99.1 /100 | #101 | Exceptional 38.7% |
| Zimbabweans | 99.1 /100 | #102 | Exceptional 38.7% |
| Immigrants | Cameroon | 99.0 /100 | #103 | Exceptional 38.7% |
| Immigrants | Eritrea | 99.0 /100 | #104 | Exceptional 38.7% |