Fijian vs Yup'ik In Labor Force | Age 20-64
COMPARE
Fijian
Yup'ik
In Labor Force | Age 20-64
In Labor Force | Age 20-64 Comparison
Fijians
Yup'ik
78.4%
IN LABOR FORCE | AGE 20-64
0.1/ 100
METRIC RATING
262nd/ 347
METRIC RANK
73.2%
IN LABOR FORCE | AGE 20-64
0.0/ 100
METRIC RATING
337th/ 347
METRIC RANK
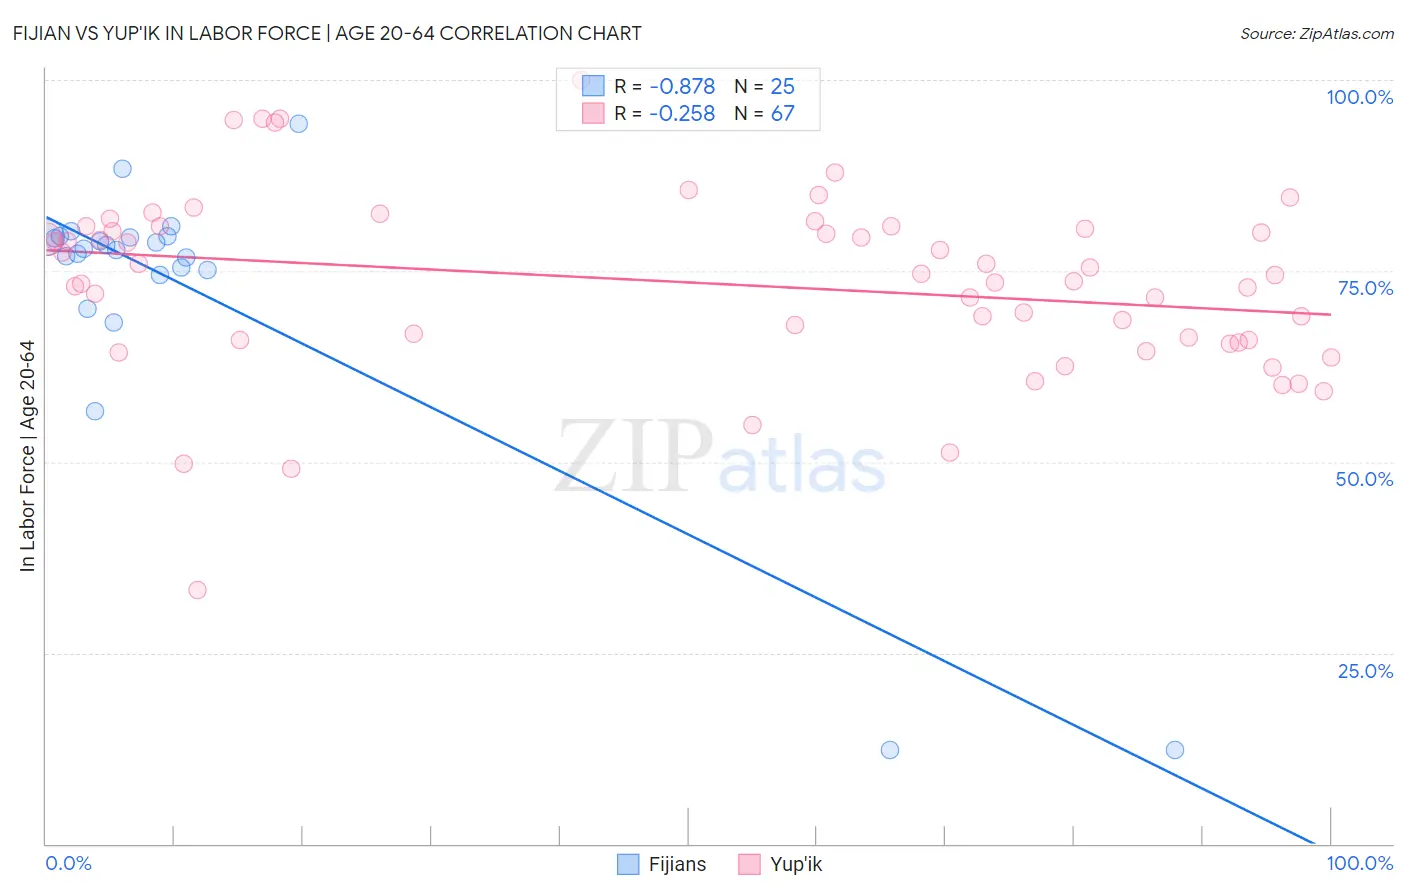
Fijian vs Yup'ik In Labor Force | Age 20-64 Correlation Chart
The statistical analysis conducted on geographies consisting of 55,948,069 people shows a very strong negative correlation between the proportion of Fijians and labor force participation rate among population between the ages 20 and 64 in the United States with a correlation coefficient (R) of -0.878 and weighted average of 78.4%. Similarly, the statistical analysis conducted on geographies consisting of 39,964,003 people shows a weak negative correlation between the proportion of Yup'ik and labor force participation rate among population between the ages 20 and 64 in the United States with a correlation coefficient (R) of -0.258 and weighted average of 73.2%, a difference of 7.1%.
In Labor Force | Age 20-64 Correlation Summary
| Measurement | Fijian | Yup'ik |
| Minimum | 12.2% | 33.3% |
| Maximum | 94.3% | 100.0% |
| Range | 82.1% | 66.7% |
| Mean | 72.3% | 73.4% |
| Median | 77.9% | 74.4% |
| Interquartile 25% (IQ1) | 74.8% | 66.0% |
| Interquartile 75% (IQ3) | 79.5% | 80.8% |
| Interquartile Range (IQR) | 4.7% | 14.8% |
| Standard Deviation (Sample) | 19.2% | 11.9% |
| Standard Deviation (Population) | 18.9% | 11.8% |
Similar Demographics by In Labor Force | Age 20-64
Demographics Similar to Fijians by In Labor Force | Age 20-64
In terms of in labor force | age 20-64, the demographic groups most similar to Fijians are Pennsylvania German (78.4%, a difference of 0.010%), Spaniard (78.4%, a difference of 0.020%), British West Indian (78.4%, a difference of 0.060%), Bahamian (78.4%, a difference of 0.060%), and U.S. Virgin Islander (78.4%, a difference of 0.080%).
| Demographics | Rating | Rank | In Labor Force | Age 20-64 |
| Hawaiians | 0.5 /100 | #255 | Tragic 78.7% |
| Celtics | 0.5 /100 | #256 | Tragic 78.7% |
| Guatemalans | 0.4 /100 | #257 | Tragic 78.7% |
| Immigrants | Guatemala | 0.4 /100 | #258 | Tragic 78.7% |
| Tsimshian | 0.4 /100 | #259 | Tragic 78.7% |
| Immigrants | Fiji | 0.3 /100 | #260 | Tragic 78.6% |
| Whites/Caucasians | 0.2 /100 | #261 | Tragic 78.5% |
| Fijians | 0.1 /100 | #262 | Tragic 78.4% |
| Pennsylvania Germans | 0.1 /100 | #263 | Tragic 78.4% |
| Spaniards | 0.1 /100 | #264 | Tragic 78.4% |
| British West Indians | 0.1 /100 | #265 | Tragic 78.4% |
| Bahamians | 0.1 /100 | #266 | Tragic 78.4% |
| U.S. Virgin Islanders | 0.1 /100 | #267 | Tragic 78.4% |
| West Indians | 0.0 /100 | #268 | Tragic 78.3% |
| Immigrants | Barbados | 0.0 /100 | #269 | Tragic 78.3% |
Demographics Similar to Yup'ik by In Labor Force | Age 20-64
In terms of in labor force | age 20-64, the demographic groups most similar to Yup'ik are Crow (73.3%, a difference of 0.12%), Puerto Rican (73.1%, a difference of 0.21%), Ute (73.7%, a difference of 0.63%), Apache (73.7%, a difference of 0.64%), and Houma (72.7%, a difference of 0.64%).
| Demographics | Rating | Rank | In Labor Force | Age 20-64 |
| Colville | 0.0 /100 | #330 | Tragic 74.8% |
| Paiute | 0.0 /100 | #331 | Tragic 74.7% |
| Arapaho | 0.0 /100 | #332 | Tragic 74.4% |
| Natives/Alaskans | 0.0 /100 | #333 | Tragic 73.9% |
| Apache | 0.0 /100 | #334 | Tragic 73.7% |
| Ute | 0.0 /100 | #335 | Tragic 73.7% |
| Crow | 0.0 /100 | #336 | Tragic 73.3% |
| Yup'ik | 0.0 /100 | #337 | Tragic 73.2% |
| Puerto Ricans | 0.0 /100 | #338 | Tragic 73.1% |
| Houma | 0.0 /100 | #339 | Tragic 72.7% |
| Pueblo | 0.0 /100 | #340 | Tragic 72.6% |
| Immigrants | Yemen | 0.0 /100 | #341 | Tragic 72.3% |
| Yuman | 0.0 /100 | #342 | Tragic 71.7% |
| Hopi | 0.0 /100 | #343 | Tragic 71.7% |
| Lumbee | 0.0 /100 | #344 | Tragic 70.6% |