Fijian vs Comanche In Labor Force | Age 20-64
COMPARE
Fijian
Comanche
In Labor Force | Age 20-64
In Labor Force | Age 20-64 Comparison
Fijians
Comanche
78.4%
IN LABOR FORCE | AGE 20-64
0.1/ 100
METRIC RATING
262nd/ 347
METRIC RANK
77.0%
IN LABOR FORCE | AGE 20-64
0.0/ 100
METRIC RATING
310th/ 347
METRIC RANK
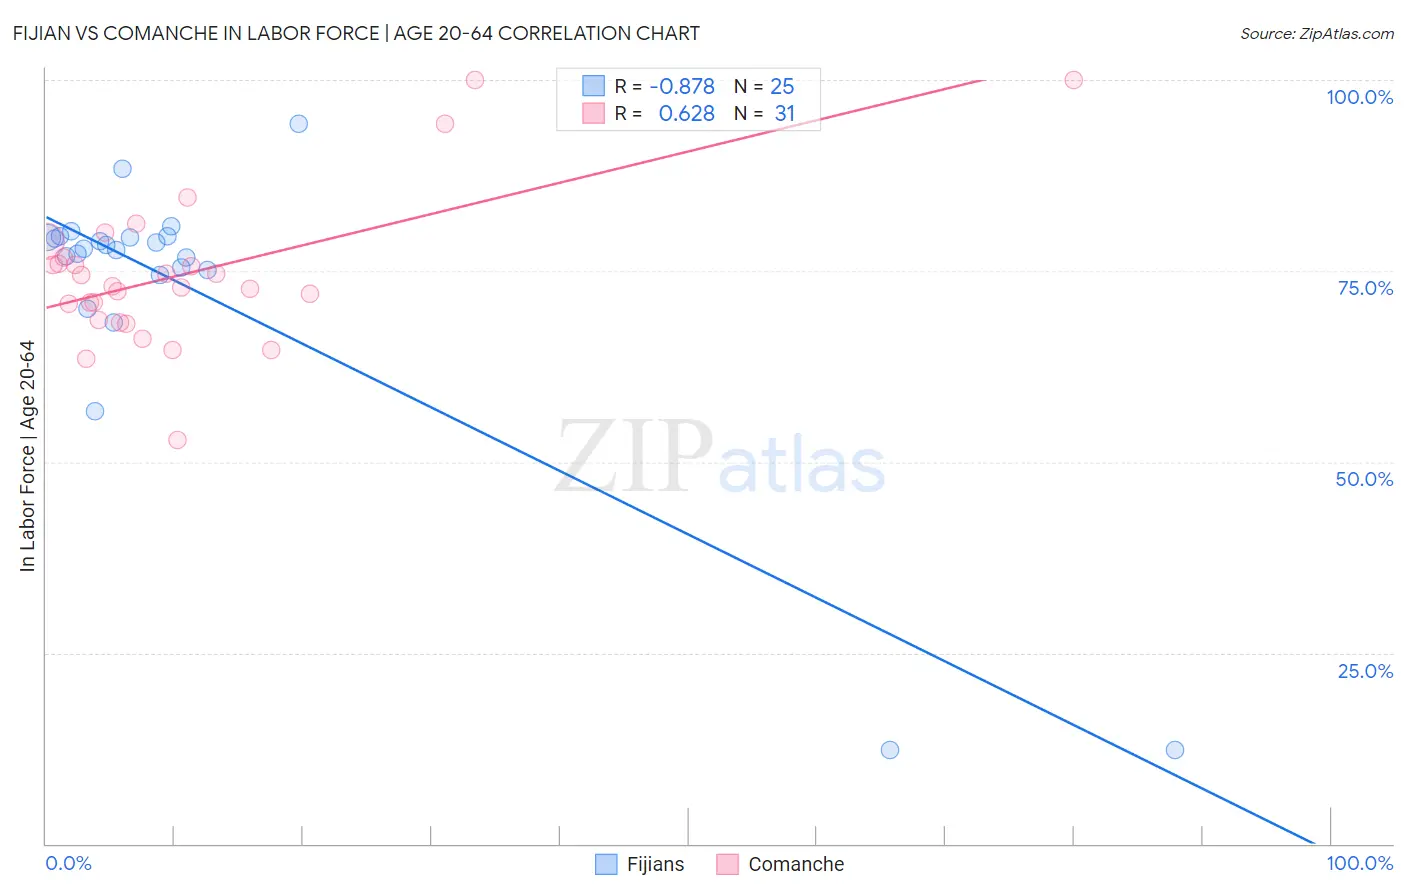
Fijian vs Comanche In Labor Force | Age 20-64 Correlation Chart
The statistical analysis conducted on geographies consisting of 55,948,069 people shows a very strong negative correlation between the proportion of Fijians and labor force participation rate among population between the ages 20 and 64 in the United States with a correlation coefficient (R) of -0.878 and weighted average of 78.4%. Similarly, the statistical analysis conducted on geographies consisting of 109,783,732 people shows a significant positive correlation between the proportion of Comanche and labor force participation rate among population between the ages 20 and 64 in the United States with a correlation coefficient (R) of 0.628 and weighted average of 77.0%, a difference of 1.8%.
In Labor Force | Age 20-64 Correlation Summary
| Measurement | Fijian | Comanche |
| Minimum | 12.2% | 52.9% |
| Maximum | 94.3% | 100.0% |
| Range | 82.1% | 47.1% |
| Mean | 72.3% | 74.7% |
| Median | 77.9% | 73.0% |
| Interquartile 25% (IQ1) | 74.8% | 68.6% |
| Interquartile 75% (IQ3) | 79.5% | 76.8% |
| Interquartile Range (IQR) | 4.7% | 8.3% |
| Standard Deviation (Sample) | 19.2% | 9.9% |
| Standard Deviation (Population) | 18.9% | 9.7% |
Similar Demographics by In Labor Force | Age 20-64
Demographics Similar to Fijians by In Labor Force | Age 20-64
In terms of in labor force | age 20-64, the demographic groups most similar to Fijians are Pennsylvania German (78.4%, a difference of 0.010%), Spaniard (78.4%, a difference of 0.020%), British West Indian (78.4%, a difference of 0.060%), Bahamian (78.4%, a difference of 0.060%), and U.S. Virgin Islander (78.4%, a difference of 0.080%).
| Demographics | Rating | Rank | In Labor Force | Age 20-64 |
| Hawaiians | 0.5 /100 | #255 | Tragic 78.7% |
| Celtics | 0.5 /100 | #256 | Tragic 78.7% |
| Guatemalans | 0.4 /100 | #257 | Tragic 78.7% |
| Immigrants | Guatemala | 0.4 /100 | #258 | Tragic 78.7% |
| Tsimshian | 0.4 /100 | #259 | Tragic 78.7% |
| Immigrants | Fiji | 0.3 /100 | #260 | Tragic 78.6% |
| Whites/Caucasians | 0.2 /100 | #261 | Tragic 78.5% |
| Fijians | 0.1 /100 | #262 | Tragic 78.4% |
| Pennsylvania Germans | 0.1 /100 | #263 | Tragic 78.4% |
| Spaniards | 0.1 /100 | #264 | Tragic 78.4% |
| British West Indians | 0.1 /100 | #265 | Tragic 78.4% |
| Bahamians | 0.1 /100 | #266 | Tragic 78.4% |
| U.S. Virgin Islanders | 0.1 /100 | #267 | Tragic 78.4% |
| West Indians | 0.0 /100 | #268 | Tragic 78.3% |
| Immigrants | Barbados | 0.0 /100 | #269 | Tragic 78.3% |
Demographics Similar to Comanche by In Labor Force | Age 20-64
In terms of in labor force | age 20-64, the demographic groups most similar to Comanche are Alaska Native (77.0%, a difference of 0.020%), American (77.0%, a difference of 0.020%), Blackfeet (77.0%, a difference of 0.030%), Central American Indian (77.1%, a difference of 0.080%), and Alaskan Athabascan (76.9%, a difference of 0.21%).
| Demographics | Rating | Rank | In Labor Force | Age 20-64 |
| Chippewa | 0.0 /100 | #303 | Tragic 77.3% |
| Immigrants | Mexico | 0.0 /100 | #304 | Tragic 77.3% |
| Mexicans | 0.0 /100 | #305 | Tragic 77.2% |
| Potawatomi | 0.0 /100 | #306 | Tragic 77.2% |
| Central American Indians | 0.0 /100 | #307 | Tragic 77.1% |
| Alaska Natives | 0.0 /100 | #308 | Tragic 77.0% |
| Americans | 0.0 /100 | #309 | Tragic 77.0% |
| Comanche | 0.0 /100 | #310 | Tragic 77.0% |
| Blackfeet | 0.0 /100 | #311 | Tragic 77.0% |
| Alaskan Athabascans | 0.0 /100 | #312 | Tragic 76.9% |
| Shoshone | 0.0 /100 | #313 | Tragic 76.8% |
| Blacks/African Americans | 0.0 /100 | #314 | Tragic 76.8% |
| Ottawa | 0.0 /100 | #315 | Tragic 76.7% |
| Yaqui | 0.0 /100 | #316 | Tragic 76.5% |
| Cherokee | 0.0 /100 | #317 | Tragic 76.2% |