European vs Indonesian In Labor Force | Age 35-44
COMPARE
European
Indonesian
In Labor Force | Age 35-44
In Labor Force | Age 35-44 Comparison
Europeans
Indonesians
84.1%
IN LABOR FORCE | AGE 35-44
12.2/ 100
METRIC RATING
215th/ 347
METRIC RANK
83.7%
IN LABOR FORCE | AGE 35-44
0.8/ 100
METRIC RATING
248th/ 347
METRIC RANK
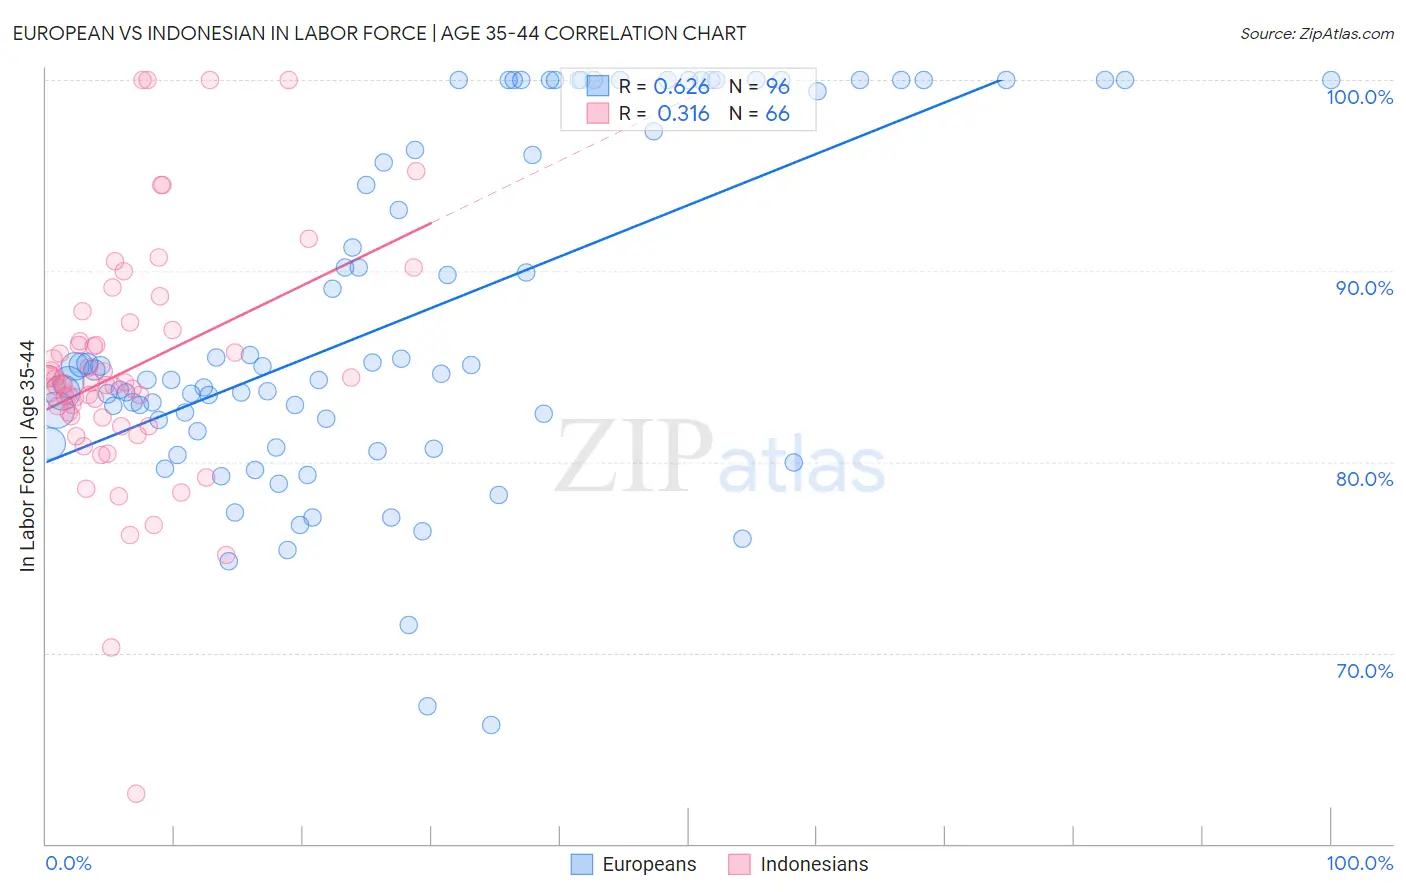
European vs Indonesian In Labor Force | Age 35-44 Correlation Chart
The statistical analysis conducted on geographies consisting of 561,223,760 people shows a significant positive correlation between the proportion of Europeans and labor force participation rate among population between the ages 35 and 44 in the United States with a correlation coefficient (R) of 0.626 and weighted average of 84.1%. Similarly, the statistical analysis conducted on geographies consisting of 162,640,915 people shows a mild positive correlation between the proportion of Indonesians and labor force participation rate among population between the ages 35 and 44 in the United States with a correlation coefficient (R) of 0.316 and weighted average of 83.7%, a difference of 0.46%.
In Labor Force | Age 35-44 Correlation Summary
| Measurement | European | Indonesian |
| Minimum | 66.2% | 62.6% |
| Maximum | 100.0% | 100.0% |
| Range | 33.8% | 37.4% |
| Mean | 87.6% | 84.8% |
| Median | 84.7% | 84.1% |
| Interquartile 25% (IQ1) | 81.9% | 82.3% |
| Interquartile 75% (IQ3) | 99.7% | 86.9% |
| Interquartile Range (IQR) | 17.8% | 4.6% |
| Standard Deviation (Sample) | 9.0% | 6.4% |
| Standard Deviation (Population) | 8.9% | 6.4% |
Similar Demographics by In Labor Force | Age 35-44
Demographics Similar to Europeans by In Labor Force | Age 35-44
In terms of in labor force | age 35-44, the demographic groups most similar to Europeans are Nicaraguan (84.1%, a difference of 0.0%), Immigrants from Barbados (84.1%, a difference of 0.010%), Immigrants from Norway (84.1%, a difference of 0.010%), Bangladeshi (84.1%, a difference of 0.020%), and Israeli (84.1%, a difference of 0.030%).
| Demographics | Rating | Rank | In Labor Force | Age 35-44 |
| Immigrants | North America | 18.1 /100 | #208 | Poor 84.2% |
| Swiss | 17.4 /100 | #209 | Poor 84.2% |
| New Zealanders | 16.2 /100 | #210 | Poor 84.1% |
| Immigrants | Ecuador | 15.2 /100 | #211 | Poor 84.1% |
| Israelis | 14.0 /100 | #212 | Poor 84.1% |
| Bangladeshis | 13.7 /100 | #213 | Poor 84.1% |
| Immigrants | Barbados | 13.2 /100 | #214 | Poor 84.1% |
| Europeans | 12.2 /100 | #215 | Poor 84.1% |
| Nicaraguans | 12.1 /100 | #216 | Poor 84.1% |
| Immigrants | Norway | 11.7 /100 | #217 | Poor 84.1% |
| Immigrants | Nicaragua | 9.4 /100 | #218 | Tragic 84.1% |
| Sub-Saharan Africans | 9.3 /100 | #219 | Tragic 84.1% |
| French | 7.5 /100 | #220 | Tragic 84.0% |
| Icelanders | 6.7 /100 | #221 | Tragic 84.0% |
| Assyrians/Chaldeans/Syriacs | 6.6 /100 | #222 | Tragic 84.0% |
Demographics Similar to Indonesians by In Labor Force | Age 35-44
In terms of in labor force | age 35-44, the demographic groups most similar to Indonesians are Immigrants from Armenia (83.7%, a difference of 0.020%), Immigrants (83.7%, a difference of 0.030%), Immigrants from St. Vincent and the Grenadines (83.7%, a difference of 0.030%), Immigrants from Cambodia (83.8%, a difference of 0.050%), and Immigrants from Western Asia (83.8%, a difference of 0.050%).
| Demographics | Rating | Rank | In Labor Force | Age 35-44 |
| Iraqis | 1.3 /100 | #241 | Tragic 83.8% |
| Immigrants | Cambodia | 1.1 /100 | #242 | Tragic 83.8% |
| Immigrants | Western Asia | 1.1 /100 | #243 | Tragic 83.8% |
| Guyanese | 1.1 /100 | #244 | Tragic 83.8% |
| Malaysians | 1.1 /100 | #245 | Tragic 83.8% |
| Immigrants | Immigrants | 1.0 /100 | #246 | Tragic 83.7% |
| Immigrants | Armenia | 0.9 /100 | #247 | Tragic 83.7% |
| Indonesians | 0.8 /100 | #248 | Tragic 83.7% |
| Immigrants | St. Vincent and the Grenadines | 0.7 /100 | #249 | Tragic 83.7% |
| Whites/Caucasians | 0.5 /100 | #250 | Tragic 83.6% |
| Salvadorans | 0.4 /100 | #251 | Tragic 83.6% |
| Immigrants | Guyana | 0.4 /100 | #252 | Tragic 83.6% |
| Lebanese | 0.4 /100 | #253 | Tragic 83.6% |
| Tongans | 0.4 /100 | #254 | Tragic 83.6% |
| Immigrants | Azores | 0.3 /100 | #255 | Tragic 83.6% |